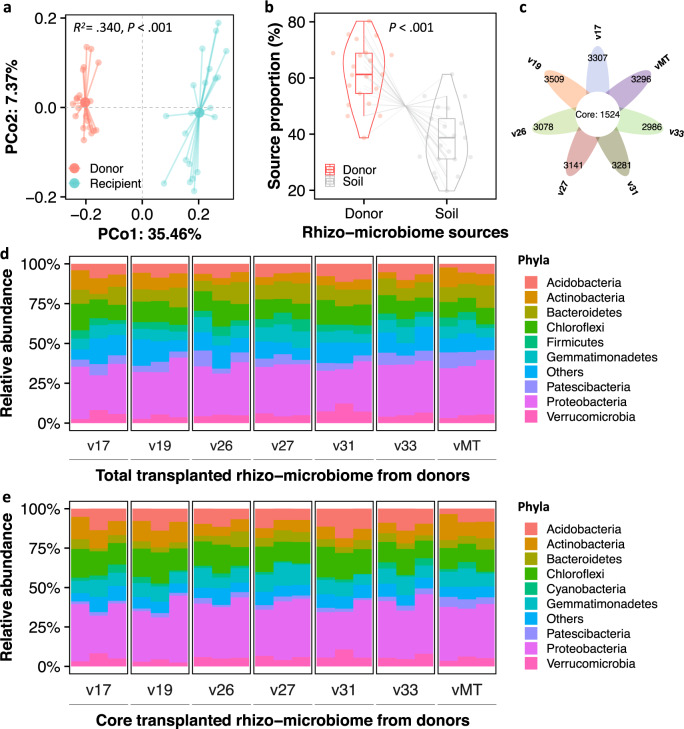
Fig. 3. Differences in the RMT from resistant Solanaceae donors to the recipient MicroTom variety.
a Principal coordinates analysis (PCoA) based on Bray-Curtis distances displaying a significant difference in the rhizosphere microbiomes between donor and recipient plants (F1,35 = 4.3, R2 = 0.301, P < 0.001, PERMANOVA). b Source proportion of the donor and the soil in the assembly of the rhizosphere microbiome of recipient tomato MicroTom plants (vMT). Gray lines denote the track of RMT from donor to recipient plants. P values were calculated using Student’s t test. c Venn diagram displaying the total and the core bacterial OTUs transplanted from each donor variety to the recipient vMT. Relative abundances of bacterial phyla associated with the total (d) and core (e) transplanted rhizosphere microbiomes from each donor variety to the recipient vMT.

