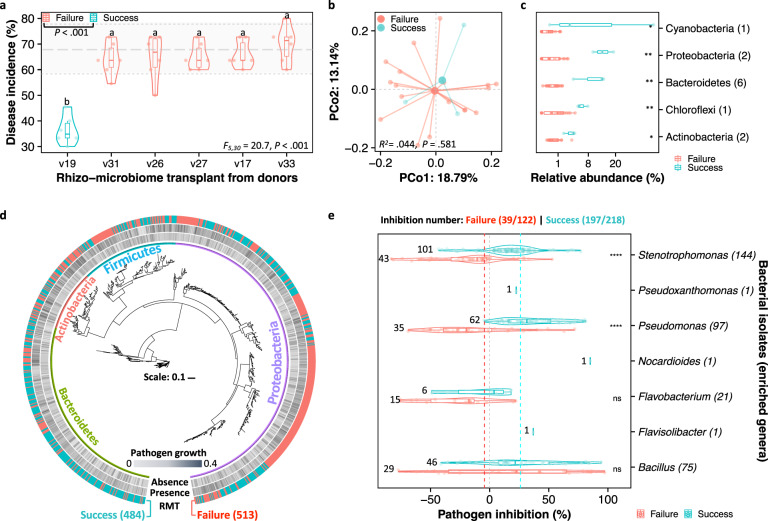
Fig. 4. Resistance to wilt disease promoted by the RMT is likely associated with the colonization of antagonistic bacterial taxa.
a Violin plot displaying the disease incidence across RMT from different resistant donors to the rhizosphere of the susceptible tomato variety MicroTom. Horizontal gray lines indicate the range of disease incidence in the control (MicroTom self-transplant, vMT). The terminologies ‘failure’ and ‘success’ denote the disease incidence similar to or significantly lower than that of the vMT, respectively. Different lowercase letters indicate significant differences in disease incidence among varieties (HSD post hoc test: P < 0.05). b Principal coordinates analysis (PCoA) based on Bray-Curtis distances displaying non-significant differences in the rhizosphere microbiomes between ‘success’ and ‘failure’ groups (F1,20 = 0.9, R2 = 0.044, P = 0.581, PERMANOVA). c Differences in relative abundances (mean proportion in each corresponding phylum > 0.01) of discriminating OTUs (linear discriminant analysis score ≥ 2, fold change ≥ 4, and significance test P < 0.05) associated with the ‘success’ group. P values were calculated using pairwise Student’s t test (*P < 0.05; **P < 0.01; ***P < 0.001). d Phylogenetic tree based on the obtained bacterial isolates and their respective influences on the growth of the pathogen R. solanacearum. The phylogenetic reconstruction was based on the Maximal likelihood method and included taxa belonging to the phyla Actinobacteria, Bacteroidetes, Firmicutes, and Proteobacteria. e Test of the inhibitory effects of the bacterial isolates on the growth of the pathogen R. solanacearum. The violin plot displays the seven genera that also had differential abundance in the ‘success’ group of plants (Supplementary Fig. 9g). The numbers in the y axis denote the number of bacterial isolates per genera.

