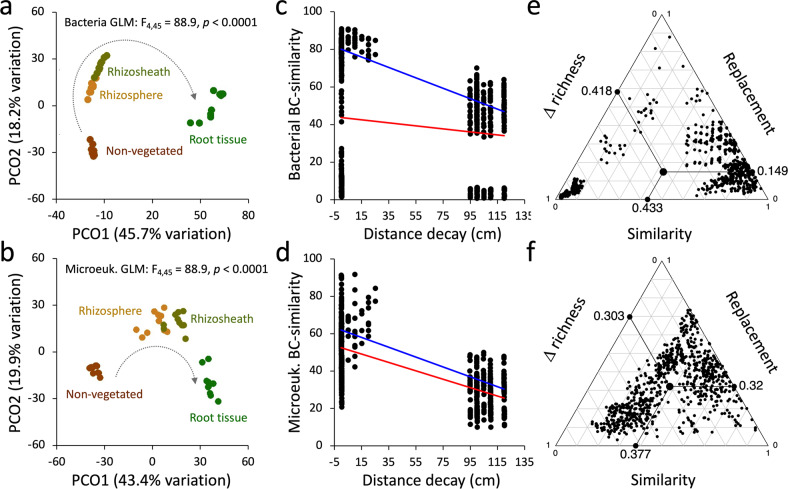
Fig. 2. Diversity and dynamics of microbial communities associated with the S. ciliata rhizosheath–root system.
Principal coordinate analysis (PCoA) of (a) bacterial and (b) microeukaryotic communities associated with the rhizosheath–root system (root tissue (RT), rhizosheath (RS) and rhizosphere (RH)) and non-vegetated (NV) soil. Arrows indicate the “horseshoes” shape distribution of microbial communities associated to different compartments, starting from the RT, and ending into the NV soils. Decay relationships among microbial communities’ similarities (BC: Bray–Curtis) and compartment relative distance (cm) for (c) bacteria and (d) microeukaryotes; red regression lines indicate the significant correlation among BC’ similarity and distance considering all the compartments. We note that when excluding the root tissues from the analyses, the correlation coefficients increased; blue regression lines, bacteria: p < 0.0001, R2 = 0.81; microeukaryotes: p < 0.0001, R2 = 0.73. Ternary plot presenting the variation in species composition among sites (beta-diversity) as result of its three components: similarity, replacement and richness difference [51]; the indices decomposing beta-diversity are visualized for the (e) bacterial and (f) microeukaryotic communities. Each point represents a pair of samples, and its position is determined by a triplet of values from the similarity, replacement, and richness difference. In each ternary plot, the large central dots where the lines start are the centroid of the points for each beta-diversity component; the lines represent their mean values.

