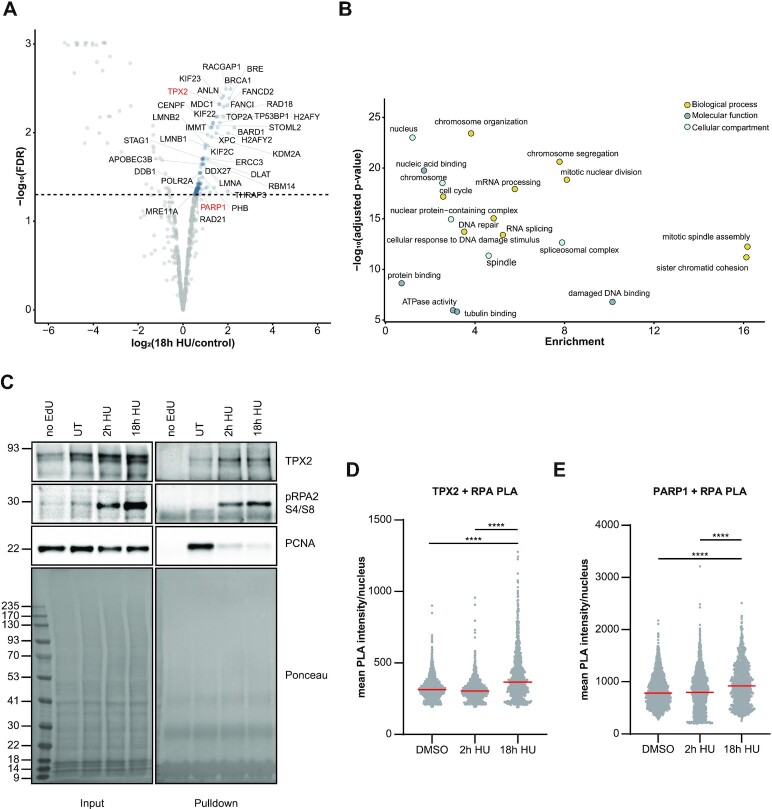
Figure 2.
Proteins recruited to persistently stalled replication forks. (A) Volcano plot displaying the results from n = 2 biologically independent SILAC iPOND experiments after 18 h hydroxyurea (HU) treatment against untreated control. FDR was calculated using limma. Selected proteins with an FDR < 5% are highlighted. (B) GO term analysis (Molecular Function, Biological Process and Cellular Compartment) of proteins enriched at persistently stalled replication forks (18 h HU) with an FDR < 5%. P-values were calculated by Fisher′s exact test and corrected for multiple comparisons using Benjamini–Hochberg correction. (C) Western blot validation of indicated proteins enriched by iPOND after 2 or 18 h hydroxyurea (HU) treatment. (D) Representative box plot of a proximity ligation assay (PLA) of n = 2 biologically independent experiments between TPX2 and RPA2 after treatment with DMSO or hydroxyurea (HU) for 2 or 18 h. Individual measurements of the mean PLA intensity per nucleus are plotted and the median indicated in red. P-values (****P-value < 0.0001) were derived from using one-way-ANOVA with Tukey correction for multiple comparisons. (E) Representative box plot of a proximity ligation assay (PLA) of n = 2 biologically independent experiments between PARP1 and RPA2 after treatment with DMSO or hydroxyurea (HU) for 2 or 18 h. Individual measurements of the mean PLA intensity per nucleus are plotted and the median indicated in red. P-values (****P-value < 0.0001) were derived from using one-way-ANOVA with Tukey correction for multiple comparisons.

