Figure 3.
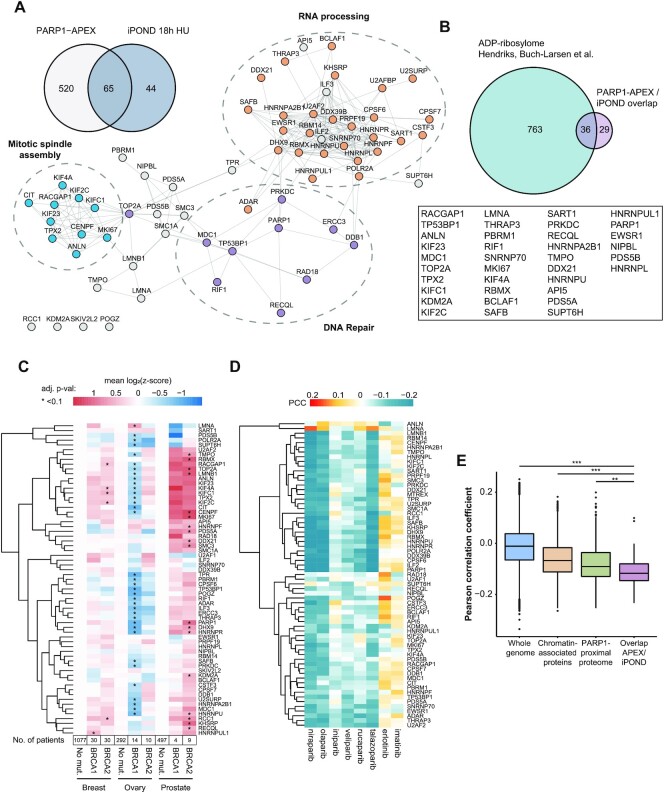
Canonical mitotic factors co-occupy stressed replication forks with PARP1. (A) Venn diagram displaying PARP1 proximal proteins that are present at persistently stalled replication forks. Interactions of the 65 proteins from the overlap were mapped in a STRING network using Cytoscape with a 0.7 confidence score cutoff. Mitotic (blue nodes), DNA repair (purple nodes) and RNA processing (orange nodes) clusters are highlighted. (B) Number of ADP-ribosylated PARP1 proximal proteins that co-occupy stressed replication forks together with PARP1 based on ADP-ribosylome from Hendriks, Buch-Larsen et al. (8). (C) Heatmap of mean z-scored mRNA expression levels in breast, ovarian and prostate cancers extracted from cBioPortal. Multiple t-tests between BRCA1/2-negative and positive cancers were performed to test significance, *adjusted P-value <0.1. P-values were adjusted using Benjamini-Hochberg correction. Number of patients contributing to the mean expression levels is depicted below each column. (D) Heatmap of Pearson correlation coefficient (PCC) between mRNA expression level and sensitivity to indicated drugs based on 558 cancer cell lines from the DepMap portal. Negative correlation indicates reduced cell viability for higher expression levels (blue color). (E) Boxplot displaying the Pearson correlation coefficient between mRNA levels and olaparib sensitivity of indicated data sets. Centers of boxplots indicate the median, limits the 25th–75th percentile, whiskers the 10th–90th percentile and dots depict outliers. P-values (**P < 0.001, ***P < 0.0001) were derived using t-test with Benjamini-Hochberg correction for multiple comparisons.

