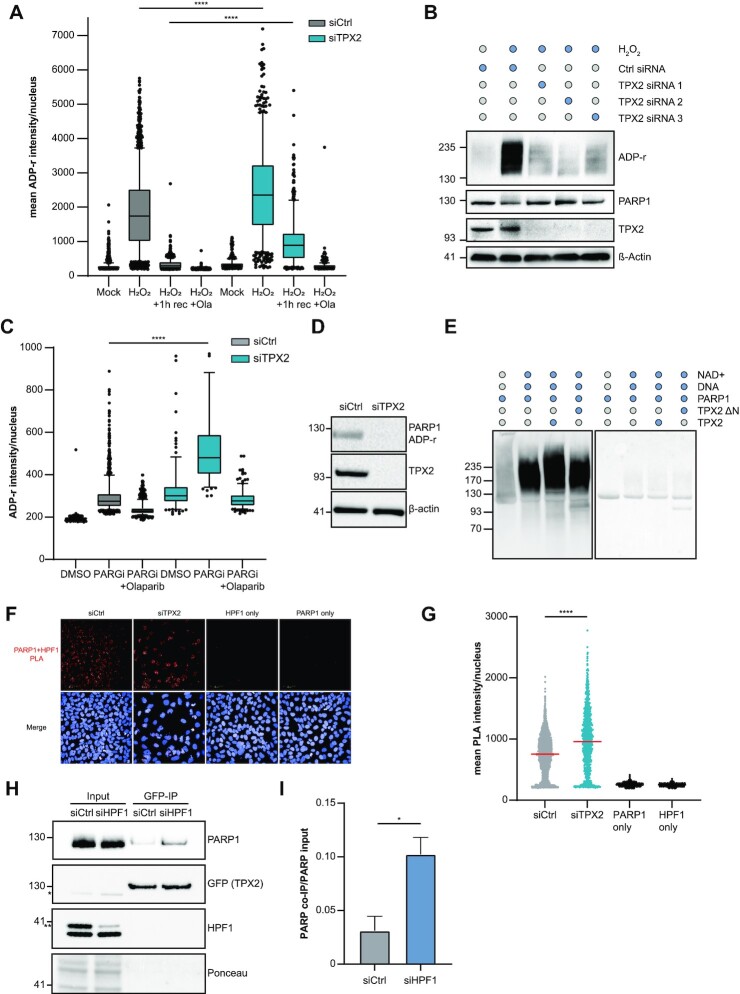
Figure 5.
TPX2 modulates PARP1 activity in vitro and in vivo. (A) Representative boxplot of n = 2 biologically independent experiments displaying the mean ADP-ribosylation per nucleus after a TPX2 (blue) or a control knockdown (grey) for 24 h. Cells were treated with 2 mM H2O2 for 10 min ± addition of 1 μM Olaparib and ±1 h recovery. The centres of the boxplots indicate the median, limits the 25th–75th percentile, whiskers the 10th–90th percentile, and dots indicate outliers. ****P-value < 0.0001, one-way ANOVA with Tukey correction for multiple comparisons. (B) ADP-ribosylation western blot after TPX2 knockdown in U2OS cells with three individual siRNAs after 2 mM H2O2 for 10 min. Control cells were pre-treated for 1 h with 1 μM olaparib. (C) Representative boxplot of n = 2 biologically independent experiments displaying the mean ADP-ribosylation per nucleus after a TPX2 (blue) or a non-targeting control knockdown (grey) for 24 h. Cells were treated with 10 mM PARGi for 1 h ± addition of 1 μM Olaparib. The centres of the boxplots indicate the median, limits the 25th–75th percentile, whiskers the 10th–90th percentile, and dots indicate outliers. ****P-value < 0.0001, one-way ANOVA with Tukey correction for multiple comparisons. (D) Western blot displaying endogenous auto-ADP-ribosylation of PARP1 after TPX2 or control knockdown. (E) Representative Western blot of n = 2 biologically independent experiments of the in vitro ADP-ribosylation assay with purified PARP1 and TPX2 proteins (full-length and ΔN mutant). Staining with an antibody against poly-ADP-ribosylation (left) and Ponceau staining (right). (F) Representative images of a proximity ligation assay (PLA) between endogenous HPF1 and PARP1 after knockdown of TPX2 or a control knockdown. PLA signal is displayed in red; Hoechst33342 staining is shown in blue. (G) Quantification of a PLA between HPF1 and PARP1 after TPX2 (turquoise) or control knockdown (grey). Individual values of the mean PLA intensity per nucleus are shown; the red line indicates the median. Antibody leave-out controls are shown in black. ****P-value < 0.0001, one-way ANOVA with Tukey correction for multiple comparisons. (H) Representative Western blot of the co-immunoprecipitation (IP) of GFP-tagged TPX2 after either a control knockdown or HPF1 knockdown. Inputs are shown on the left, GFP-IP on the right. * indicates the residual PARP1 staining after re-probing with the GFP antibody, while **indicates the specific HPF1 band. (I) Bar plot showing the mean ± SD derived from n = 2 biologically independent experiments of the GFP-TPX2 co-IP after HPF1 (blue) or control knockdown (grey). *P-value < 0.05, student′s t-test.

