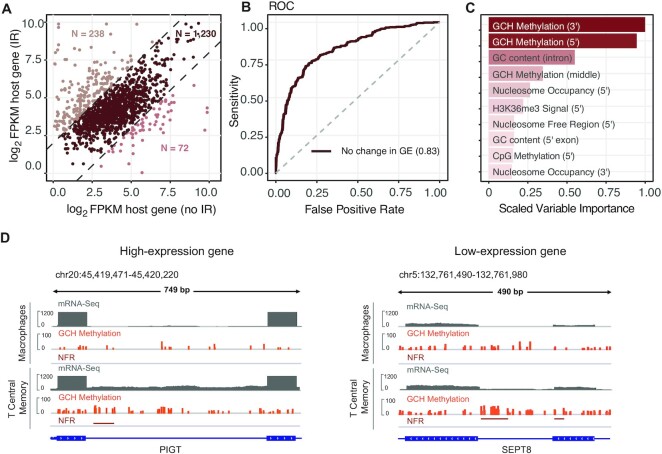
Figure 5.
Analysis of introns from genes with non-differential expression levels. (A) Scatter plot of host gene expression for introns that change their IR status. Light-coloured dots, separated by dashed diagonal lines, represent differentially expressed genes (FC ≥3; P ≤0.05). (B) ROC curve indicating the performance of a cRF model fitted on the data from non-differentially expressed genes (GE, gene expression). (C) Ranking of the features based on scaled variable importance scores. (D) Integrative Genomics Viewer (IGV) plots revealing higher density and hypermethylation levels of GCH sites in the splice site regions of differentially retained introns in both high and low expressed gene examples (NFR, nucleosome-free region; GCH, methylation methylation levels of GC dinucleotides followed by any nucleobase except guanine).

