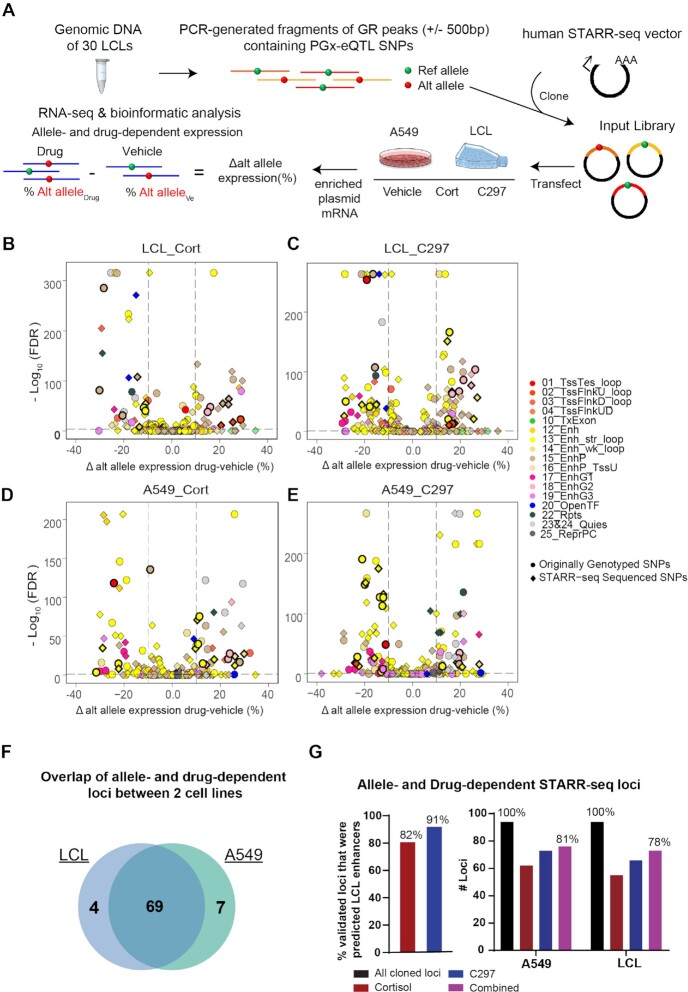
Figure 4.
Testing allele- and drug-dependent effects of PGx-eQTLs with STARR-seq, a massively parallel reporter enhancer assay. (A) Experimental workflow for STARR-seq. (B–E) Volcano plots showing PGx-eQTL loci where SNP-dependent and GR-dependent activities were detected. The Y axis represents –log10 of FDR from Fisher's Exact Test, the X axis represents change of alternative allele percentages after drug treatment. Circles represent originally genotyped SNPs, and squares represent SNPs sequenced in each STARR-seq locus. Each SNP was color coded by the chromatin state in which they resided. All loci that were later found to be associated with diseases that achieved statistical significance for SNP-dependent and GR-dependent transcriptional analysis are bolded in black. (F) High consistency between the two cell lines, LCL and A549, used in the STARR-seq assay in terms of loci that displayed allele- and drug-dependent properties. (G) STARR-seq results validated allele- and drug-dependent enhancer activities of identified PGx-eQTL loci.

