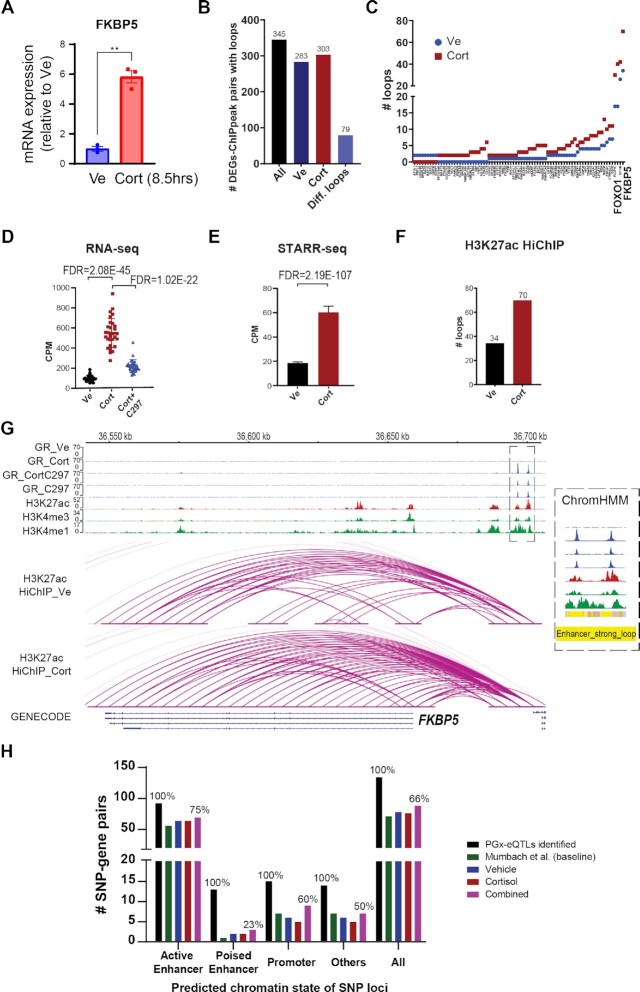
Figure 5.
Generation and integration of H3K27ac HiChIP before and after glucocorticoid treatment with other datasets. (A) Validation of drug treatment effect for HiChIP samples as measured by qRT-PCR for FKBP5, a prototypical GR-targeted gene, using RNA extracted from the same cells. Statistical significance was evaluated with Student's t-test, achieving P < 0.005. Each dot represents a replicate. (B) Number of cortisol-regulated genes that were connected to a cortisol-induced GR ChIP-peak by a H3K27ac loop in different treatment conditions. (C) Cortisol-regulated genes that were connected to one or more cortisol-induced GR ChIP-peaks by differential cortisol-regulated H3K27ac loop(s) (fold change > 1.5 or a change from 0 that is more than 1). The X axis shows gene names (Please see Supplementary Data 1 for a complete list of gene names). (D) mRNA expression of FKBP5 before and after drug treatment as determined by RNA-seq. CPM represents counts per million. (E) Transcriptional activity driven by the enhancer region upstream of FKBP5 as measured by STARR-seq. (F) Number of HiChIP H3K27ac loops that connected GR-binding sites to the FKBP5 gene. (G) Integrative Genomics Viewer (IGV) plots of two different GR-dependent enhancers over a distance of 50kb, which together regulated FKBP5. These two enhancers were predicted to be strong enhancers with looping properties by ChromHMM. (H) Number of PGx-eQTLs that displayed physical interactions between SNP loci (categorized by enhancer/non-enhancer states) and eQTL genes as demonstrated by H3K27ac HiChIP.

