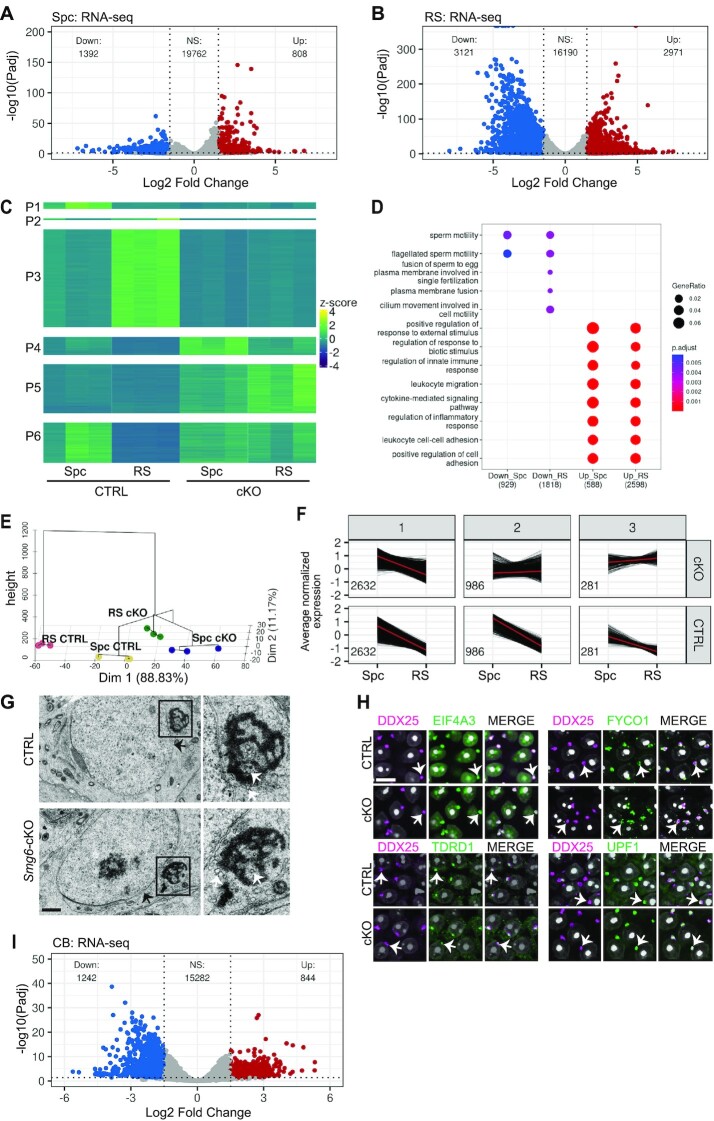
Figure 5.
Deletion of Smg6 induces transcriptome imbalance in germ cells. Volcano plots show differential expression of genes in spermatocytes (A) and round spermatids (B). (C) Heat-map visualizes the six expression patterns (P1-P6) after clustering according to the differential gene expression in CTRL Spc, CTRL RS, Smg6-cKO Spc and Smg6-cKO RS. (D) Biological Process GO term enrichment for down- and upregulated genes in Smg6-cKO versus CTRL Spc and RS. Top Biological Processes were selected for visualization based on adjusted P-values (gradient scale with red indicating the most significant value). GeneRatio: the amount of genes associated with the GO term divided by the total number of genes. Count: the number of genes associated to the GO term illustrated by a dot with a proportional size according to the number of associated genes found in our gene list. Plots were generated in R using clusterProfiler (v3.18.1). (E) Distribution and clustering of each group against each other (Spc CTRL, Spc cKO, RS CTRL, RS cKO) on a PCA plot, combined with a dendrogram using FactoMineR (v.2.4) in R. (F) Genes downregulated in CTRL RS versus Spc were partitioned into three expression patterns (1-3) according to their expression in Smg6-cKO germ cells. The number of differentially expressed genes for each expression pattern is indicated inside each panel. (G) Electron microscopy of the CB in CTRL and Smg6-cKO round spermatids. Scale bar: 1 μm. The CB indicated with black box is shown in higher magnification on the right panel. Black arrows indicate the nuclear membrane, white arrows indicate small vesicles located near or within the lobes of the CB. (H) PFA-fixed paraffin-embedded testis section were co-immunostained with anti-DDX25 (magenta) together with anti-EIF4A3, anti-FYCO1, anti-UPF1 or anti-TDRD1 (green). DAPI stains nuclei (white). White arrows indicate one selected CB in each figure. Scale bar: 10 μm. (I) Volcano plot to demonstrate differential expression of genes in CBs. See also Supplementary Figure S5 and Supplementary Tables S1 and S3.

