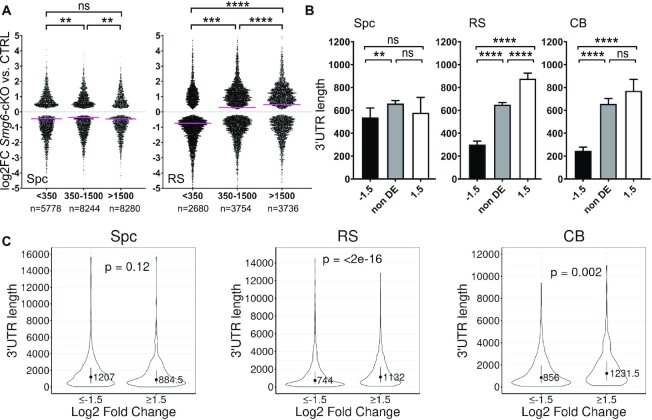
Figure 6.
Smg6 deletion affects the 3′UTR length distribution. (A) Swarm plot showing the distribution of fold change of transcripts in Smg6-cKO vs. CTRL for the significantly differentially expressed transcripts (y-axis; log2 fold change values) by 3′ UTR length (x-axis; length given in nucleotides). Transcripts were divided into three groups on the basis of their 3′UTR length: transcripts containing 3′UTR longer than 1500 nt, between 350 and 1500 nt, and shorter than 350 nt. Kruskal–Wallis test with Dunn's multiple comparisons was used to determine the significance values between groups (indicated with * above groups). Median values are indicated by pink lines (Spc > 1500: –0.4589, Spc 350–1500: –0.3597 and Spc < 350: –0.4494, RS > 1500: 0.4809, RS 350–1500: 0.2879 and RS < 350: –0.7401). (B) The length of 3′UTRs were plotted for downregulated (log2FC ≤ –1.5), non-differentially expressed (non DE, log2FC between –1.5 and 1.5) and upregulated (log2FC ≥ 1.5) transcripts in Smg6-cKO spermatocytes, round spermatids and CBs. A Kruskal-Wallis test and a Dunn post-hoc test was used to determine the difference between the median values of the groups (significance indicated with * above groups). Error bars represent median with 95% CI. (C) Violin plots showing the 3′UTR length for Cufflink-assembled DE transcripts (log2FC ≥ 1.5 and ≤ –1.5) in spermatocytes, round spermatids and CBs. Error bars represent median ± IQR, P-values from Wilcoxon-test. See also Supplementary Figure S5 and Supplementary Tables S4.

