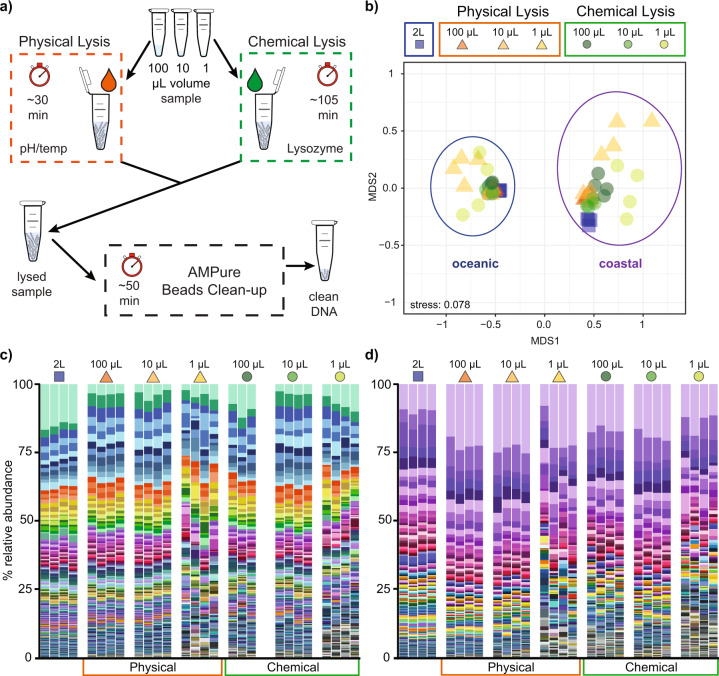
Fig. 1. Microvolume DNA extraction method and resulting taxonomic composition of 16S rRNA gene amplicons from the different extraction methods and seawater volumes tested.
a Microvolume (e.g. 100 µL, 10 µL, 1 µL) DNA extraction protocol for both physical lysis (which relies on both pH and thermal shock to lyse cells and takes ~30 min for a batch of ten samples) and chemical lysis (which uses lysozyme and SDS to lyse cells and takes ~105 min for a batch of ten samples). Cell lysate is then cleaned using AMPure beads, which takes about 50 min and results in purified DNA ready to be used in a variety of downstream applications (e.g. amplicon sequencing, shotgun metagenomics, Nano-string, qPCR, etc). A more detailed version of this schematic is presented in Fig. S1. b Non-metric multidimensional scaling (nMDS) plot based on Bray–Curtis distance between samples. Ovals highlight statistically different consortia between the two sampling sites (PERMANOVA, p < 0.001, Table S8); within those ovals the consortia were not statistically different irrespective of volume or extraction method (PERMANOVA, p > 0.4, Tables S9, S10). Microbial diversity of amplicon sequence variants (ASVs) (>0.1% relative abundance in at least one replicate extraction) are displayed for each site separately: c oceanic sampling site and d coastal sampling site. ASVs are ordered by decreasing relative abundance. ASVs that were rare in the bulk 2 L extraction (<0.1% relative abundance), but made up >0.1% of one of the microvolume extractions, are coloured in various shades of blue in all extractions. ASVs absent from the 2 L extraction are coloured in various shades of grey and present at the bottom of the bar chart. The full legend for c and d can be found in Tables S11, S12. Note: the colour palettes used for c and d are different.

