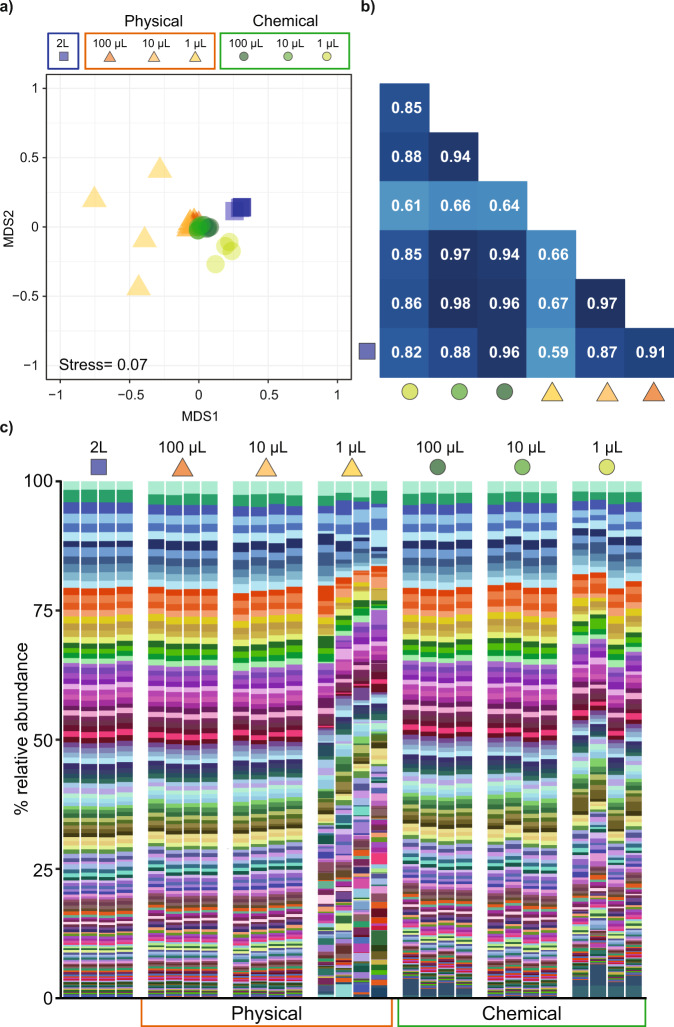
Fig. 2. Functional composition of the seawater metagenomes from the oceanic site using the different methods and seawater volumes.
a Non-metric multidimensional scaling (nMDS) plot based on Bray-Curtis distance between the annotated genes from prokaryotes. All samples were statistically indistinguishable (PERMANOVA p > 0.05, Table S14). b Spearman’s correlation analysis of the KO-based averaged functional profile of the annotated genes with at least 100 reads, all correlations shown are statistically significant (p < 0.0001). c Metagenomic genes (>0.3% relative abundance in at least one sample) identified from the 2 L extraction; physical lysis (100 µL, 10 µL, 1 µL); and chemical extractions (100 µL, 10 µL, 1 µL). The full legend for c can be found in Table S16.

