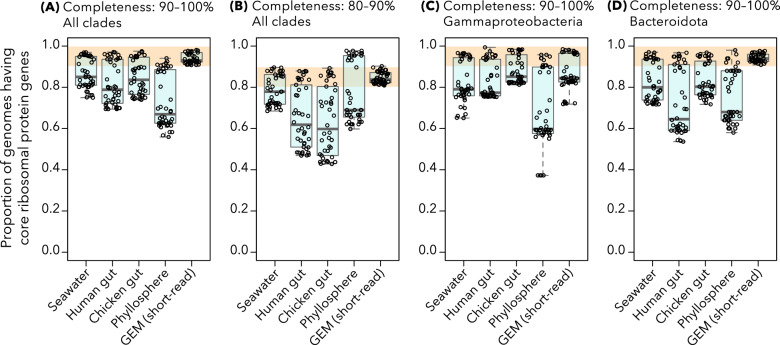
Fig. 1. Proportion of MAGs harboring each ribosomal protein ortholog from five MAG datasets reconstructed using only short-read sequences.
Each point represents one ribosomal protein ortholog (listed in Supplementary Table S1). Lines within each box and whiskers indicate three quartiles and the maximum/minimum values, respectively. Orange bands indicate the value ranges that could be expected from completeness of MAGs. Panels A and B show the results for all the bacterial MAGs with 90–100% and 80–90% completeness, respectively. Panels C and D show the results of MAGs with 90–100% completeness classified as class Gammaproteobacteria and phylum Bacteroidota, respectively. The definition of each phylum/class is slightly inconsistent between the five sets of MAGs because different versions of the GTDB were used for taxonomic annotations (Table 1).

