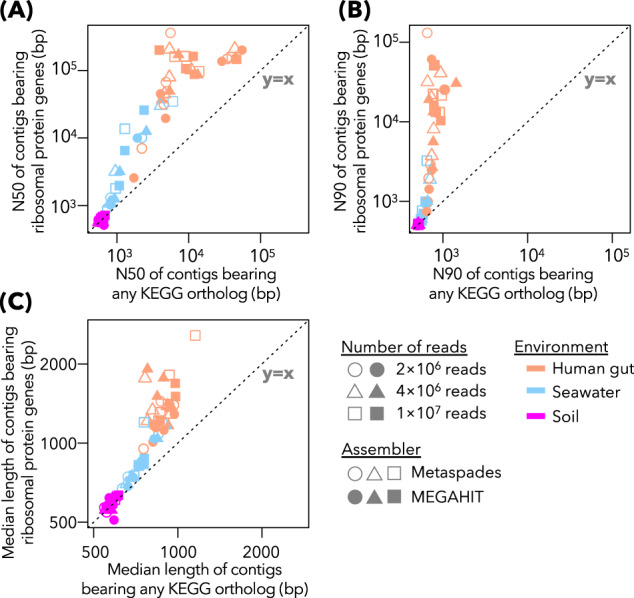
Fig. 3. Distribution of ribosomal protein genes in assembled contigs.

The relationship between N50 of all the contigs bearing any KEGG ortholog and N50 of the contigs bearing at least one ribosomal protein ortholog. Each point represents one assembly and is colored according to the source material of metagenome. The dotted line indicates y = x, where two N50 values are equal. B Same as A, although N90 was used instead of N50. C Same as A, although the median length of the contigs was used instead of N50.
