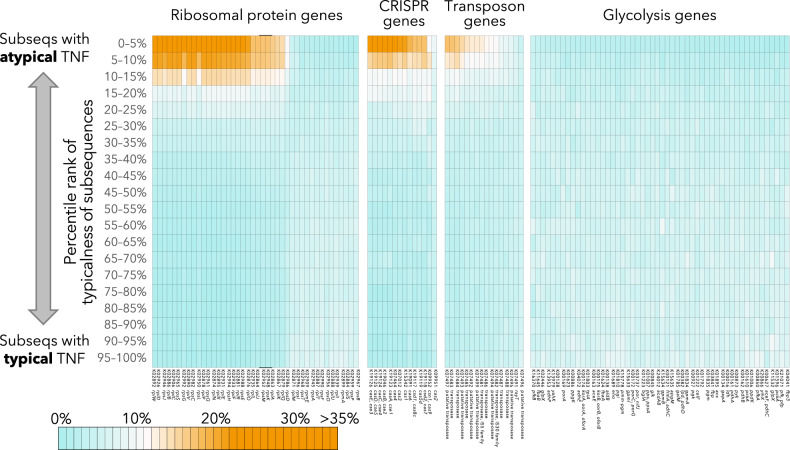
Fig. 4. Enrichment of orthologs in subsequences with typical and atypical tetranucleotide frequencies.
Each column summarizes the distribution of each ortholog among subsequences. The colors (range from blue, white, to orange) indicate the proportion of gene copies found on subsequences with specific typicalness ranks. For example, if cells in deep orange are aggregated in upper rows, that ortholog is enriched in subsequences with highly atypical tetranucleotide frequencies. TNF tetranucleotide frequency.

