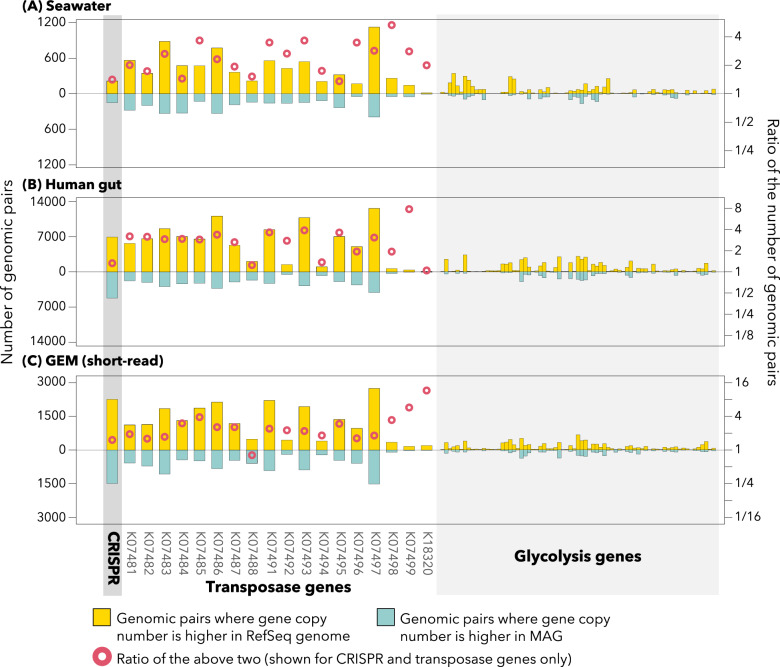
Fig. 5. Distribution of CRISPR, transposase genes, and glycolysis genes among phylogenetically close MAGs and RefSeq genomes.
The number of CRISPRs or each ortholog was counted for each MAG and phylogenetically close RefSeq genome pair. A yellow or blue bar indicates the number of pairs where the RefSeq genome or the MAG had a higher number of CRISPRs (or the ortholog), respectively (left axis). A red circle (for CRISPRs and transposase genes only) represents the ratio of these two (the former divided by the latter) (right axis, log scale). Three panels indicate the results for three different MAG datasets: seawater (A), the human gut (B), and the GEM (C).

