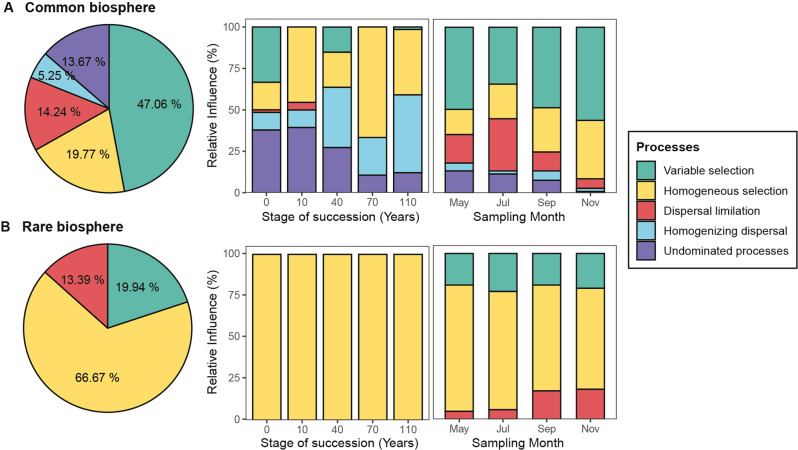
Fig. 3. Relative influence of assembly processes structuring the soil bacterial communities.
(A) the common biosphere and (B) the rare biosphere. Pie plots show the relative influence of each assembly process shapes the species turnover of the rare and common biospheres across all samples. Bar plots in the middle and right show the interplay of assembly processes governing the temporal variation of communities within each successional stage (i.e., 0, 10, 40, 70, and 110 years in succession), and the assembly processes driving the spatial variation of communities across successional stages at four sampling times (i.e., May, July, September, and November). The βNTI and RCbray values were used to quantify the relative importance of each assembly process. Colors represent different assembly processes, i.e., variable selection, homogeneous selection, dispersal limitation, homogenizing dispersal, and undominated processes. The asterisk denotes the impact of homogenizing dispersal and undominated processes for the turnover of the whole community, which are 0.56% and 0.06%, respectively.

