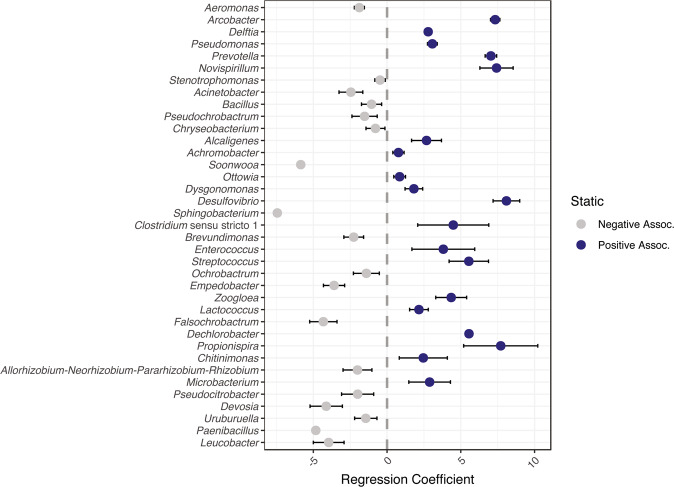
Fig. 4. Differential abundance calculated using beta binomial regression at genus level between shaking and static conditions [58].
This model tested for differential abundance and variability between cultivation conditions, while controlling for the effect of dilution and day on dispersion. Blue refers to genera positively associated with static conditions; gray refers to genera negatively associated with static conditions. Order of genera based on relative abundance across experiment.

