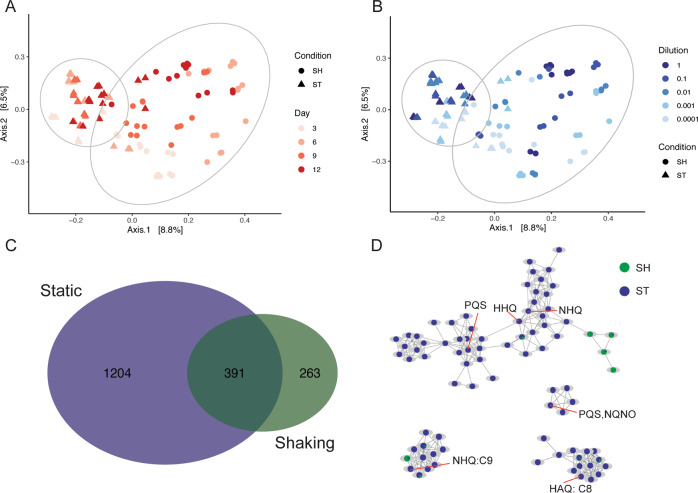
Fig. 5. Principal Coordinate Analysis of metabolites using Bray–Curtis distances.
Metabolite samples colored by A time and B inoculum size; shape and 95% CI refer to shaking (SH) or static (ST) PERMANOVA Cultivation Condition: F = 64.83, r2 = 0.07, p = 0.001. All PERMANOVA and PERMDISP results can be found in Supplementary Table 12A, B. C Venn diagram showing metabolites shared or unique between cultivation conditions. D Networks of Pseudomonad signaling metabolites. Nodes are pie charts showing the relative metabolite abundance between cultivation conditions. Orange call-out lines indicate an annotated node (see Supplementary Fig. 7 for mirror plots supporting annotations). HAQ refers to 4-hydroxy-2-octylquinolone 1-oxide. NHQ is 2-nonylquinolin-4(1H)-one. HHQ is 2-heptylquinolin-4(1H)-one. PQS is Pseudomonas quinolone signal. NQNO is 2-nonyl-4-hydroxyquinolone N-oxide [71].

