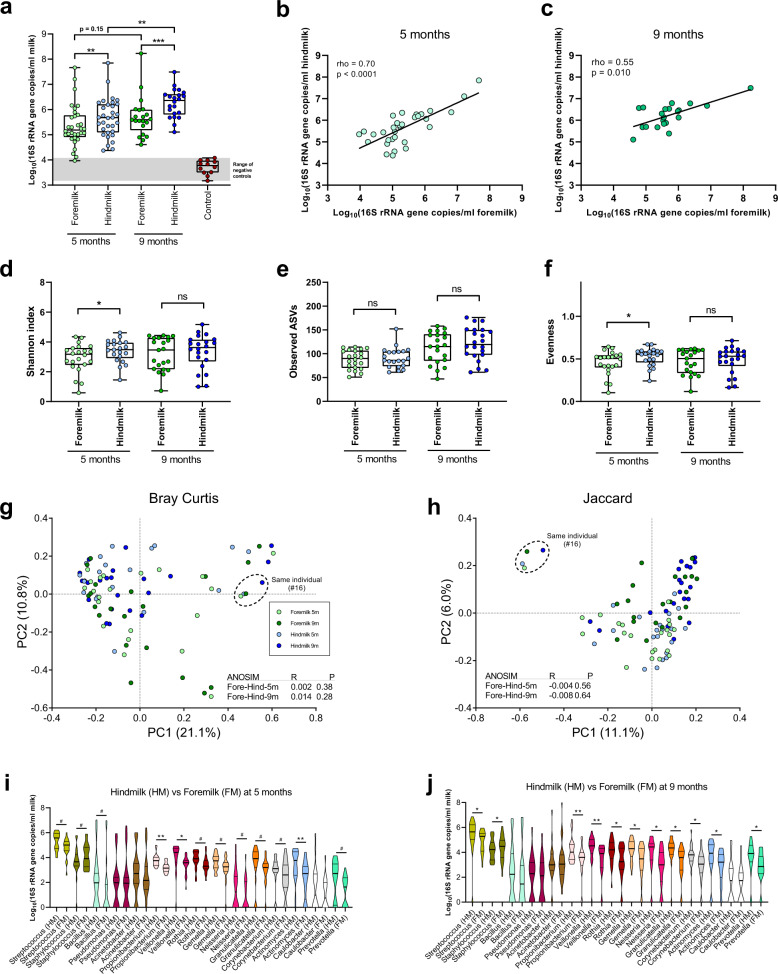
Fig. 1. Bacterial load, diversity, and composition in foremilk versus hindmilk.
a Boxplot (median; IQR; range) of bacterial load in foremilk and hindmilk at infant age 5 and 9 months, as well as DNA blank extraction controls. Statistical significance was evaluated by paired t-tests. Asterisks indicate **p < 0.01 and ***p < 0.001. b, c Scatter dot plots of bacterial load in foremilk versus hindmilk at infant age 5 (a) and 9 (b) months. A linear regression line was fitted to the log-transformed data and the relationship was evaluated by Spearman’s rank correlation analyses. d–f Boxplots (Median; IQR; Range) of bacterial alpha diversity measures, Shannon index (d), Observed ASVs (e) and Evenness index (f), comparing foremilk and hindmilk at both infant age 5 and 9 months. Statistical significance was evaluated by paired t-tests and asterisks indicate *p < 0.05. g, h PCoA plots based on Bray–Curtis (g) and Jaccard (h) dissimilarities, including foremilk and hindmilk samples at both infant age 5 and 9 months, with statistically differential clustering evaluated by ANOSIM tests. i, j Violin plots of the absolute abundances of the major genera (average relative abundance cutoff across all milk samples of 1.0%) comparing hindmilk to foremilk at infant age 5 months (i) and 9 months (j). Thick black lines indicate median and thin black lines 25 and 75 percentiles. Statistical difference was evaluated by Wilcoxon-signed rank tests and symbols indicate #FDRp = 0.05–0.1, *FDRp < 0.05, and **FDRp < 0.01.

