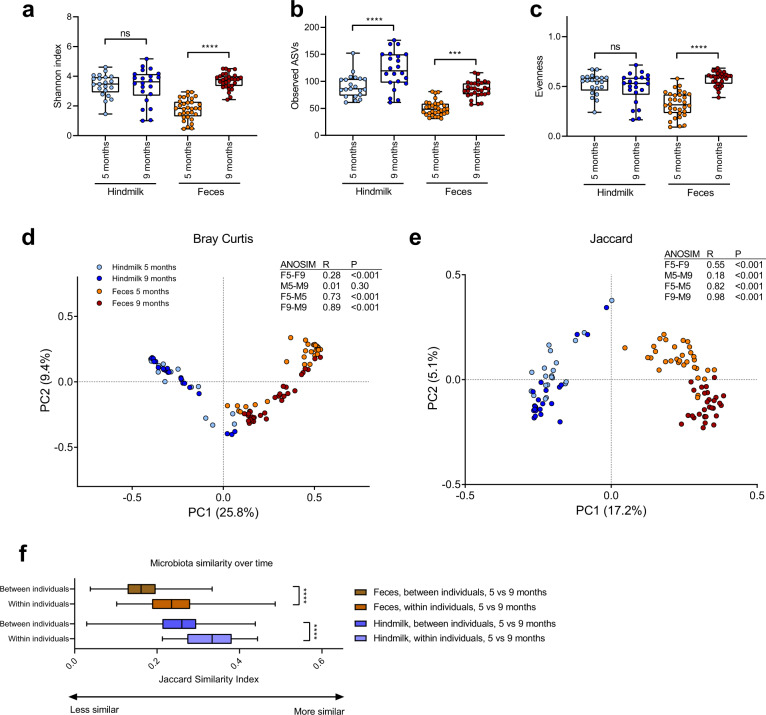
Fig. 2. Temporal development of the microbiota in hindmilk and infant’s feces.
a–c Boxplots (Median; IQR; Range) of bacterial alpha diversity measures, Shannon index (a), Observed ASVs (b), and Evenness index (c) in hindmilk and infant’s feces at infant age 5 and 9 months. Statistical significance was evaluated by paired t-tests, with asterisks indicating ***p < 0.001 and ****p < 0.0001. d, e PCoA plots based on Bray–Curtis (d) and Jaccard (e) dissimilarities, comparing across both sample type and age, with statistical differentially clustering evaluated by ANOSIM tests. f Boxplots (median; IQR; range) of microbiota similarity over time in hindmilk and infant’s feces, comparing between to within individuals. Statistical significance evaluated by Mann–Whitney test, with asterisks indicating ****p < 0.0001.

