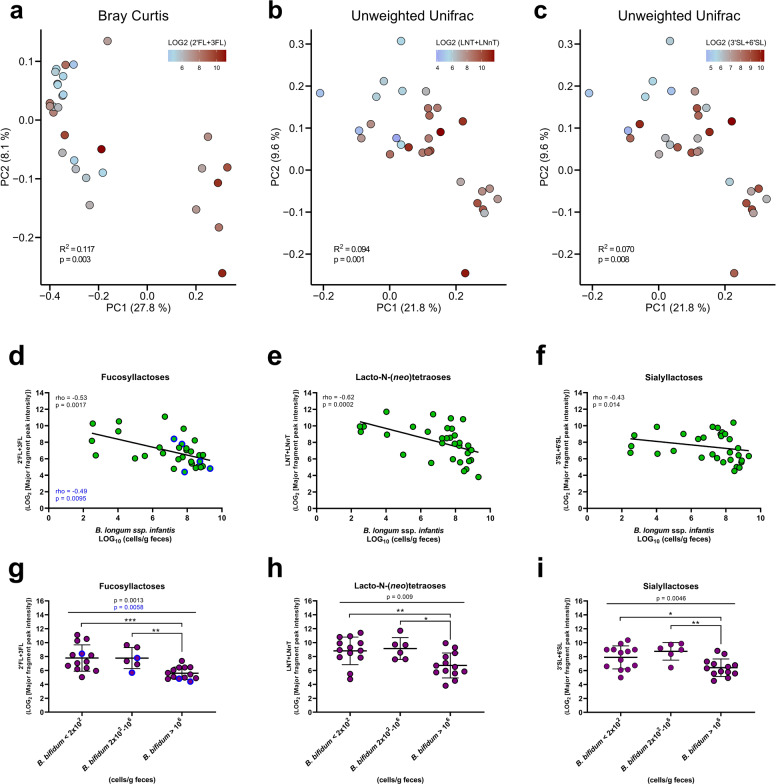
Fig. 5. Human milk oligosaccharides associate with infant fecal microbiota composition and explains abundance of specific Bifidobacterium species.
a–c PCoA plots based on a Bray–Curtis dissimilarities or b, c unweighted Unifrac distances, colored according to fecal relative abundance (LOG2 [major fragment peak intensity]) of a 2ʹFL+ 3FL, b LNT+ LNnT, and c 3ʹSL+ 6ʹSL at infant age 5 months. Statistical significance evaluated by ADONIS tests. d–f Scatter dot plots of qPCR-estimated absolute abundance of B. longum subsp. infantis versus relative abundance (LOG2 [major fragment peak intensity]) of the three HMO classes in feces at infant age 5 months. A linear regression line was fitted to the data points and associations between variables were assessed by Spearman’s rank correlation analyses. g–i Dot plots of relative abundance (LOG2 [major fragment peak intensity]) of the three HMO classes stratified according to qPCR-estimated absolute abundance of B. bifidum in feces at infant age 5 months (B. bifidum < 2 × 10² cells/g feces indicates values below limit of detection). Statistical significance was evaluated by one-way ANOVA (exact p-value indicated) with Fisher’s LSD post hoc tests with asterisks indicating *p < 0.05, **p < 0.01, and ***p < 0.001. For 2ʹFL+ 3FL (fucosyllactoses) statistical analyses (marked in blue text) were repeated excluding infants from non-secretor mothers (dots marked with blue border).

