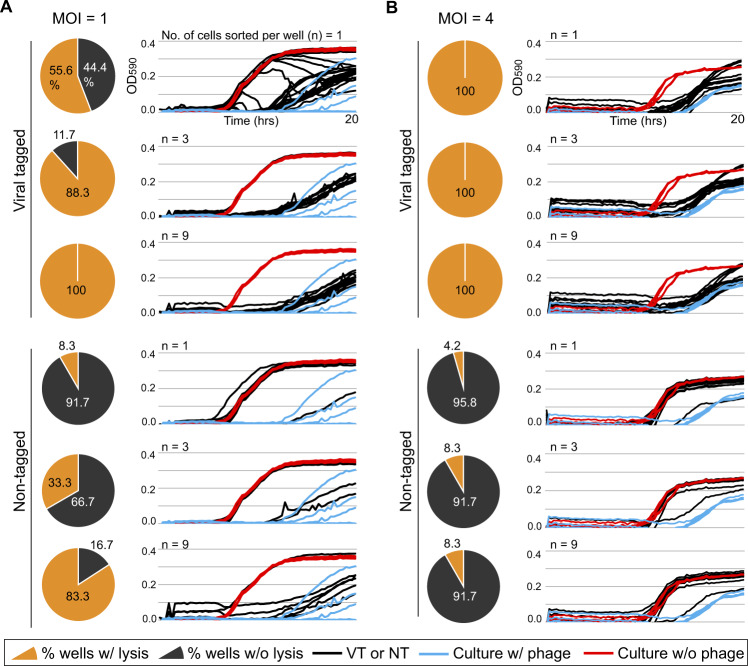
Fig. 3. Evaluation of viral growth assay under various infection conditions.
Two liquid cultures of Pseudoalteromonas strain H71 (105/ml) in the late-logarithmic growth phase were infected by specific phage HM1 at MOIs of 1 and 4, respectively. From each infected culture, varying numbers of tagged (VT) and nontagged (NT) cells were sorted into individual wells of a 96-well plate containing growth medium followed by the addition of fresh host cells (104 cells per well). Positive and negative controls (host culture with HM1 at an MOI of 0.1 and without HM1, respectively) were included in each plate (see Methods for details). From top to bottom, left to right in panels (A) MOI = 1 and (B) MOI = 4, respectively, pie charts depict the percentages of lysed (yellow) and nonlysed (gray) wells from the total wells containing the given numbers (n = 1, 3, and 9) of isolated VTs and NTs. Culture lysis for VT- and NT-containing wells was determined by comparing their growth curves (next to each pie chart, black lines) to those of negative (red) and positive controls (blue). The X-axis indicates the OD590nm and the Y-axis, the time in hours.

