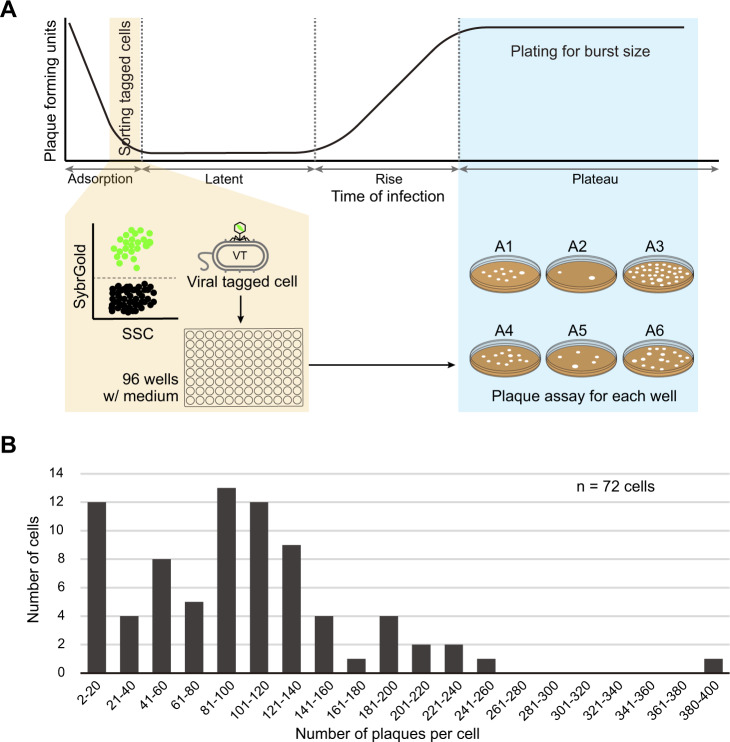
Fig. 4. Distribution of virus burst sizes per single viral-tagged cell.
A Schematic overview of single-cell assay for viral burst size determination by viral tagging and grow. In the latent period of infection, single viral-tagged cells (VTs) were sorted by flow cytometer from Pseudoalteromonas sp. H71 cells infected by phage HM1 at an MOI of 0.5 (see Methods for details). Following sorting single VTs into different wells of the 96-well plate containing growth medium (MSM), the plate was incubated to allow for viral progenies to release from infected cells. The number of viruses produced per VT was then determined by the number of plaques per poured plate using the traditional plaque assay. B Distribution of viral burst size from individual tagged cells. The number of progeny viruses (X-axis) per cell (Y-axis) are represented in bins of 20, with the exception of the first bin excluding single plaques. The number (n) of individual tagged cells assessed is represented at the top right corner.

