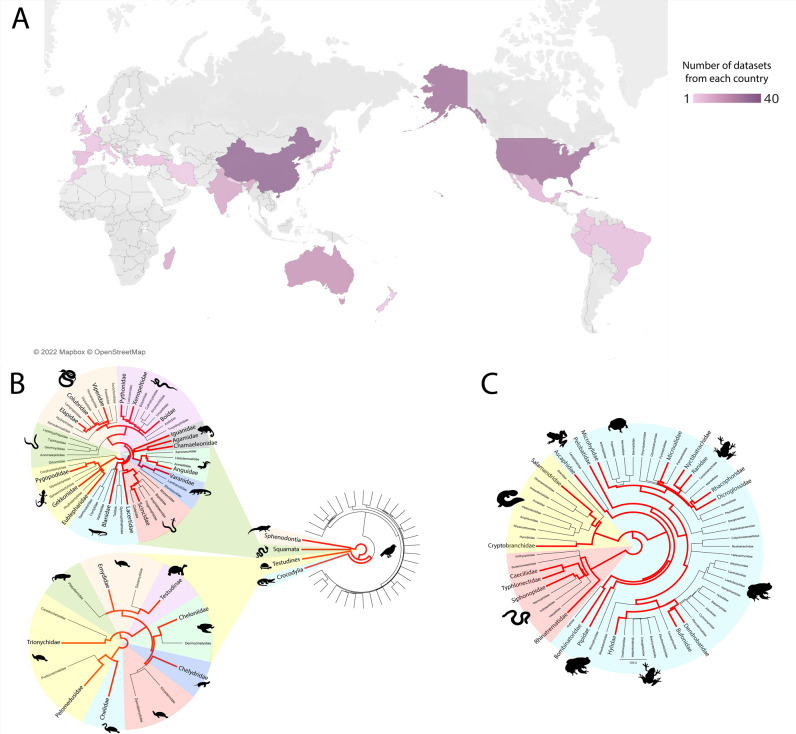
Fig. 1. Amphibian and reptile datasets included in this study.
A geographic location of sample collection. Location was obtained from NCBI SRA biosample records or the associated manuscript, where possible. Datasets where location could not be determined (n = 24) were not included in this figure. Colours represent the number of datasets from each location, with dark purple the most and light purple the least. Figure was created using Tableau Desktop (Version 2021.4.4). B Taxonomy of saurian datasets. Branches coloured red indicate one or more reptile datasets were obtained from that taxon. Evolutionary trees were generated using TimeTree. C Taxonomy of amphibian datasets. Branches coloured red indicate one or more amphibian datasets were obtained from that taxon. Evolutionary trees were generated using TimeTree.

