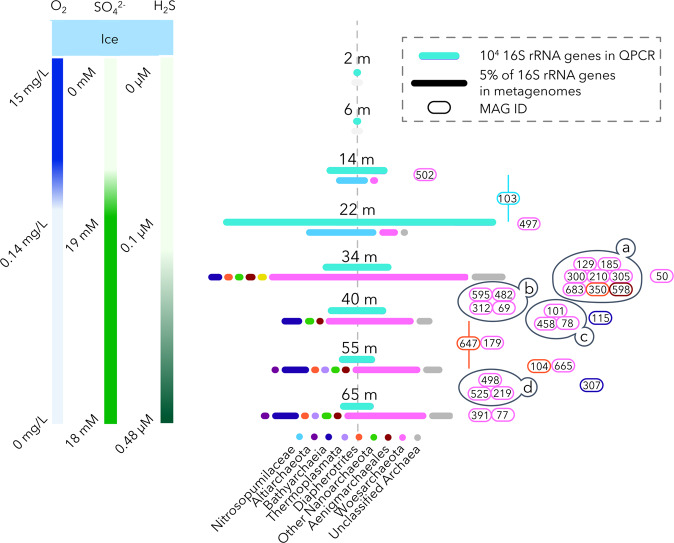
Fig. 1. Archaeal community composition and abundance.
Left-hand panel shows depth of samples along the geochemical gradients of Lake A. The right-hand panel shows the total archaeal abundance (top cyan bar), with the length of the bar based on the number of 16 S rRNA genes detected by qPCR (see legend for a 104 unit). Below this bar is the archaeal community composition, shown as colored bars, with the length of each bar based on to the relative proportion of 16 S rRNA genes identified in the metagenomes; the 5% scale bar is given in the legend. Circled numbers indicate the MAG ID and color of the circle indicates the taxonomy of the MAGs from the bottom legend. MAGs are placed at the depth of highest coverage. The horizontal line spanning 55 and 40 m for bin103 and bin647 indicates that these MAGs were recovered in similar proportions from those depths. Clusters (a,b,c,d) of distributions indicate highly correlated MAGs (R > 0.99, p < 0.0001). Detailed geochemical data for Lake A has been previously published [25, 26] and is available in the Nordicana D database (https://www.cen.ulaval.ca/nordicanad).

