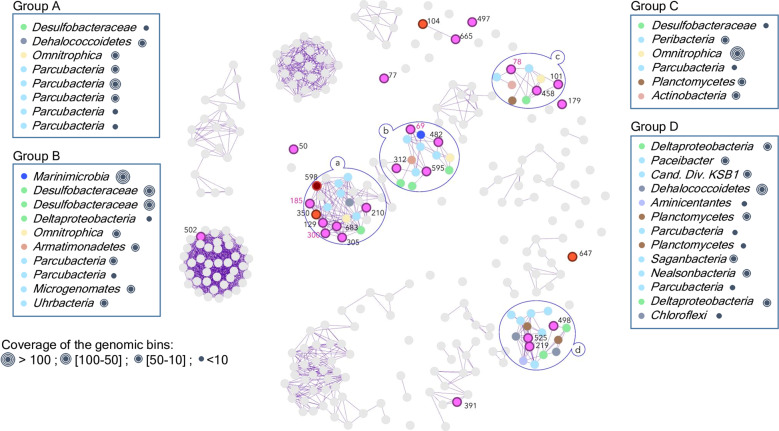
Fig. 3. Network of the microbial (bacterial and archaeal) MAGs based on the correlation matrix calculated with the average coverage per sampled depth.
MAGs of Woesearchaeota (pink bold dots), Aenigmarchaeota (brown bold dot) and Diapherotrites (orange bold dots) are color coded and labelled as in Fig. 1. Bacterial MAGs are as gray dots except for the highly correlated MAGs that are color coded by phyla. The purple lines connect MAGs with correlation coefficients (R) > 0.99.

