
Fig. 2. Functional differences at 1 year of age.
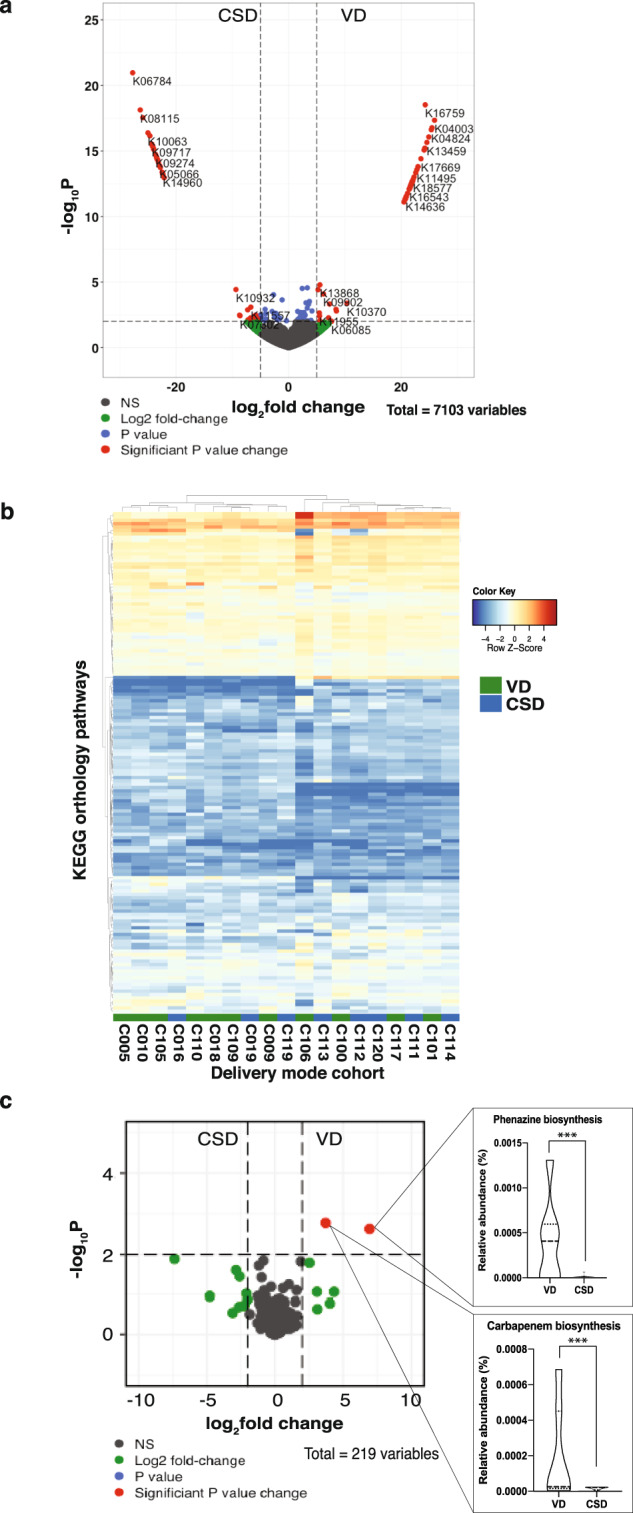
a Volcano plot depicting the statistically significantly different KEGG orthologs found in both CSD and VD groups at 1 year of age. A total of 6413 variables were tested, with −log10(p-value) shown on the y-axis. Green dots indicate KOs with a fold change >2. Red dots indicate KOs with a significant fold-change cut-off of 2, and with a false-discovery rate-adjusted p-value cut-off of 0.01. b Heatmap based on the KEGG pathways found in both CSD and VD samples at 1 year of age. Each row denotes a pathway represented by the KO genes, with the hierarchical clustering being based on Euclidean distances using Ward’s clustering algorithm. c Volcano plot of the 219 KEGG pathways to which the KOs were mapped, tested for significance with a fold-change cut-off of 2, and with a false-discovery rate-adjusted p-value cut-off of 0.01. The insets show carbapenem and phenazine biosynthesis pathways that were statically significantly different. ***p-value < 0.001.