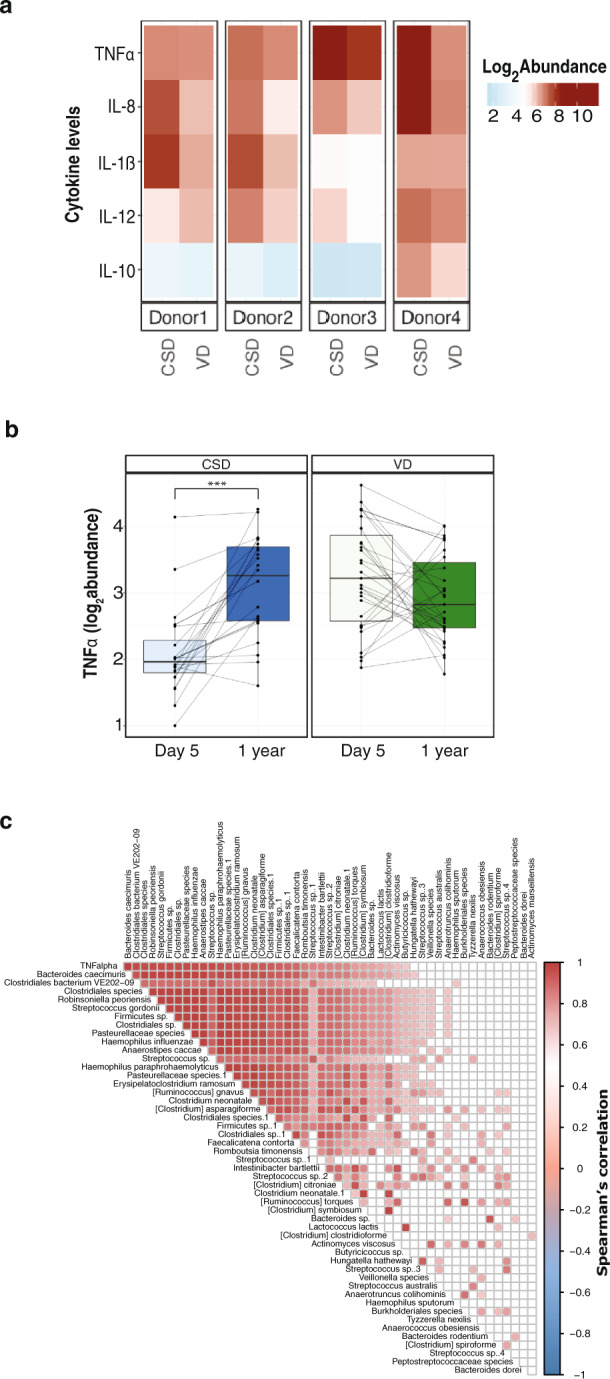
Fig. 3. Immunostimulatory potential at 1 year of age.

a Heatmap depicting the abundance (log2) of pro- and anti-inflammatory cytokines at 1 year of age. Cytokine levels were measured by stimulating MoDCs from healthy donors (Donor 1–4) with LPS isolated from faecal samples of CSD and VD neonates. b Boxplots depicting the TNF-α levels in both groups (CSD and VD) at day 5 after birth and 1 year of age. Paired two-way ANOVA (analysis of variance) p-values are listed in the plot to depict significant differences. ***p-value < 0.001. c Correlation of TNF-α levels (row 1) with the relative abundance of metagenomic OTUs based on canonical correlation analysis. Filled squares indicate significantly correlated taxa, whereas colour indicates positive (red) or negative (blue) correlation.
