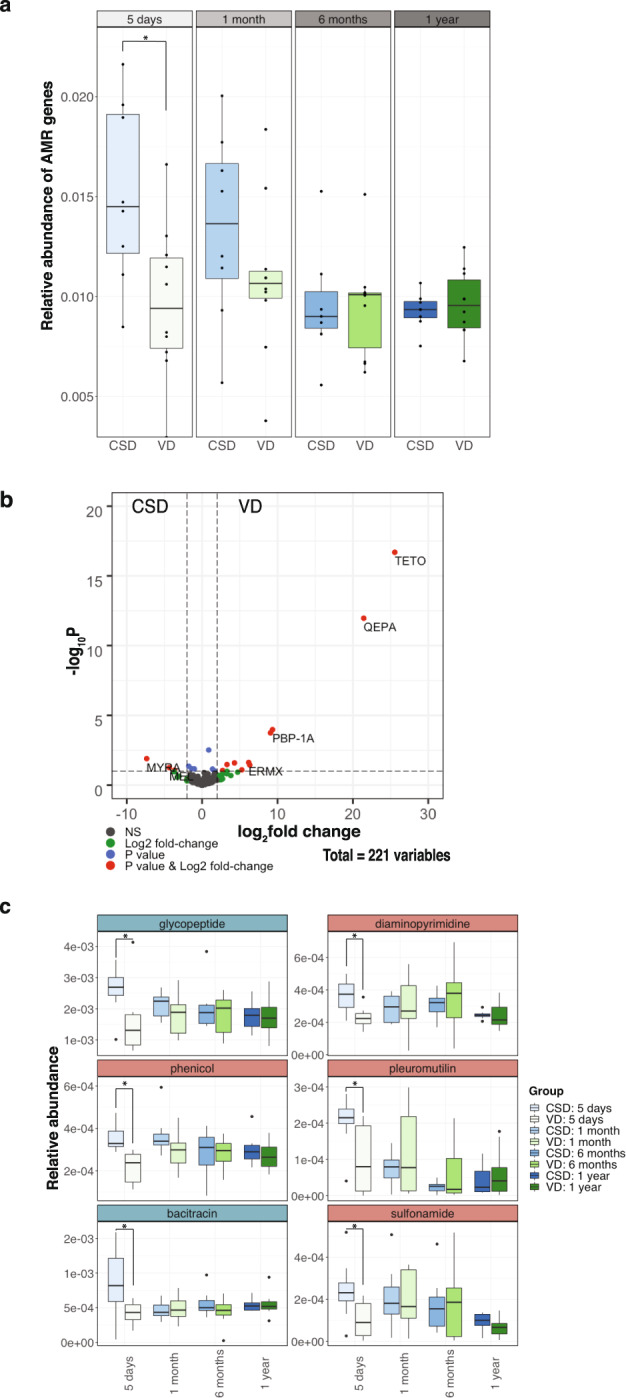
Fig. 4. Antimicrobial resistance gene abundances over time.

a Boxplots of the overall AMR gene abundance in CSD and VD samples at different timepoints including 5 days after birth and at 1 year of age. Wilcoxon rank-sum tests were used to test for significance. *p < 0.05. b Volcano plot depicting the significantly enriched genes in either CSD or VD samples at 1 year of age. c AMR categories which are significantly different between the groups at any of the timepoints are shown. Wilcoxon rank-sum tests were used to test for significance. *p < 0.05.
