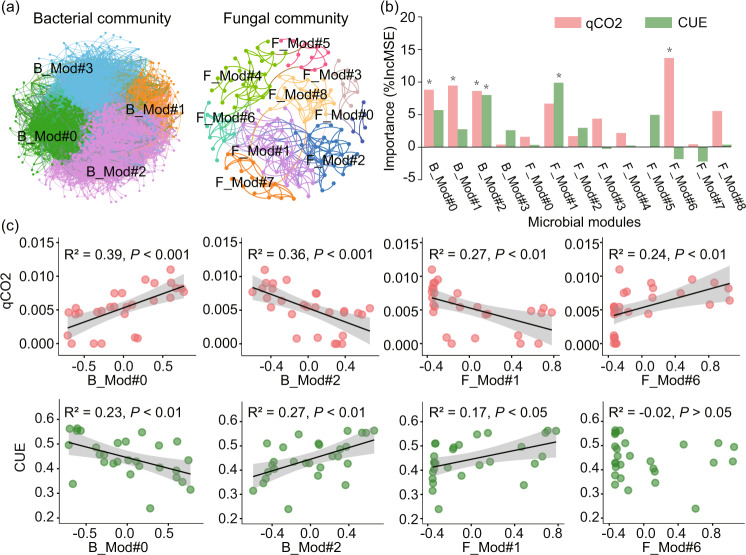
Fig. 3. Major bacterial and fungal assemblies explaining microbial metabolic efficiency.
a Network diagram with nodes (OTUs) colored by each of the major ecological modules (assemblies) within co-occurrence network of bacterial and fungal community, respectively; b key bacterial and fungal assemblies predicting metabolic quotient (qCO2) and carbon use efficiency (CUE) according to Random Forest analysis; c the relationships of key bacterial and fungal assemblies with metabolic efficiency. *P < 0.05; **P < 0.01.

