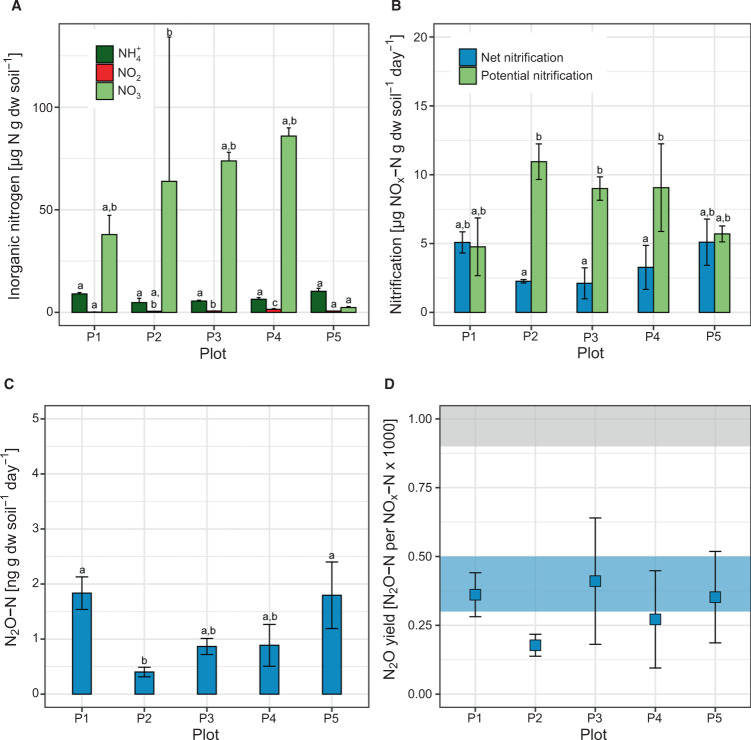
Fig. 1. Inorganic nitrogen concentrations, nitrification rates, N2O production, and N2O yield in EAA soils.
A Inorganic nitrogen concentrations, B Net nitrification (blue bars) and nitrification potentials (green bars) of EAA soils determined in microcosms and soil slurries, respectively. NOx–N refers to combined NO2−–N plus NO3−–N. C N2O–N production rates in net nitrification incubations. D Relative N2O yield of nitrification in net nitrification microcosms. Error bars denote standard deviations of n = 9 samples or incubations per plot. Different letters indicate significant difference (ANOVA with Tukey HSD test at α = 0.05 level). NO3− concentrations in plot 2 varied significantly between 68.9, 63.9, and 215.5 µg g dw soil−1 in plot 2A, 2B, and 2C, respectively. The unusually high NO3− concentration in plot 2C was confirmed twice. Shaded areas in (D) denote ranges of reported N2O yields of AOA (blue) and AOB (gray) in soils determined by selective AOB inhibition by 1-octyne (after Hink et al.31)

