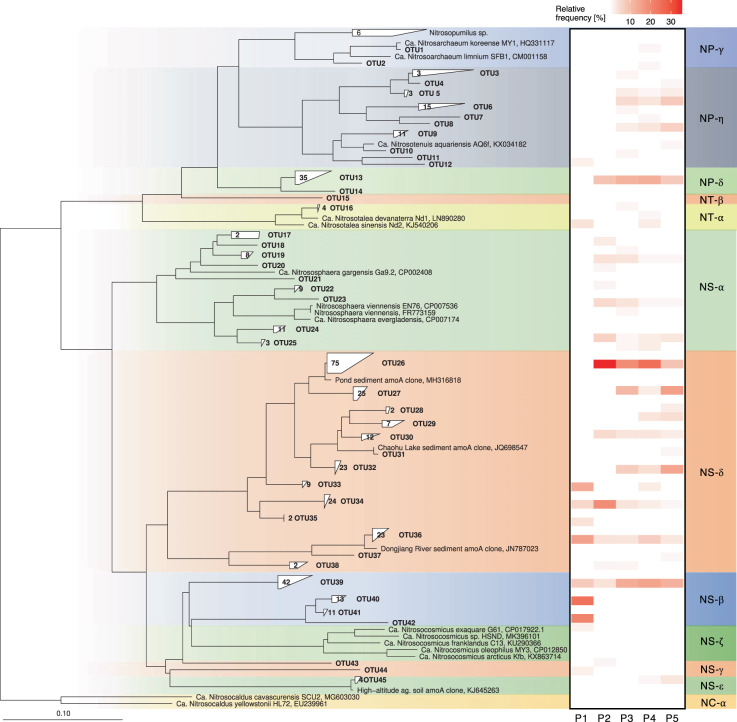
Fig. 4. Neighbor-joining phylogenetic tree of archaeal amoA gene sequences retrieved from EAA plots 1–5 and heat map of relative abundance within each plot (in %).
Tree was calculated based on 595 aligned positions using neighbor-joining algorithm with Jukes–Cantor correction. Sequences with more than 96% sequence similarity on nucleotide level were grouped into single OTUs. The total number of sequences within a given OTU, if more than one, is indicated in each tree leaf.

