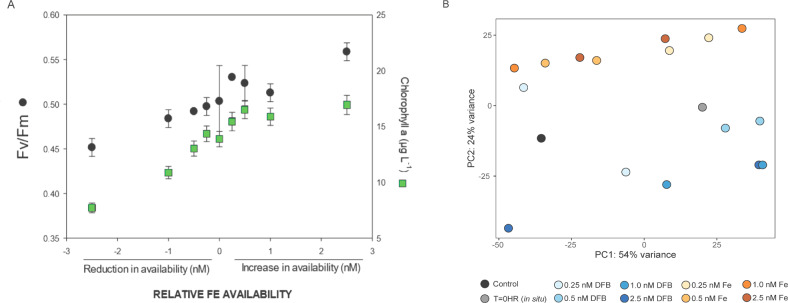
Fig. 1. Bulk community response to on-deck incubations either reducing available Fe (DFB-added) or increasing available Fe (FeCl3-added) after 72 h.
A Total phytoplankton biomass estimates (chlorophyll a concentrations, green boxes) and photosynthetic efficiency (Fv/Fm, ratio of variable fluorescence to maximal fluorescence, black circles) as a function of relative Fe availability. Results are shown as the means ± error of technical duplicates, averaged between duplicate bottles. B Principal component analysis (PCA) displaying PC1 against PC2 of total community gene transcript abundance patterns, color coded by treatment (blue = DFB-added, orange = Fe added). The black circle is the control bottle and gray circle is the T = 0 h in situ sample. Each bottle duplicate is plotted, with the exception of the control.

