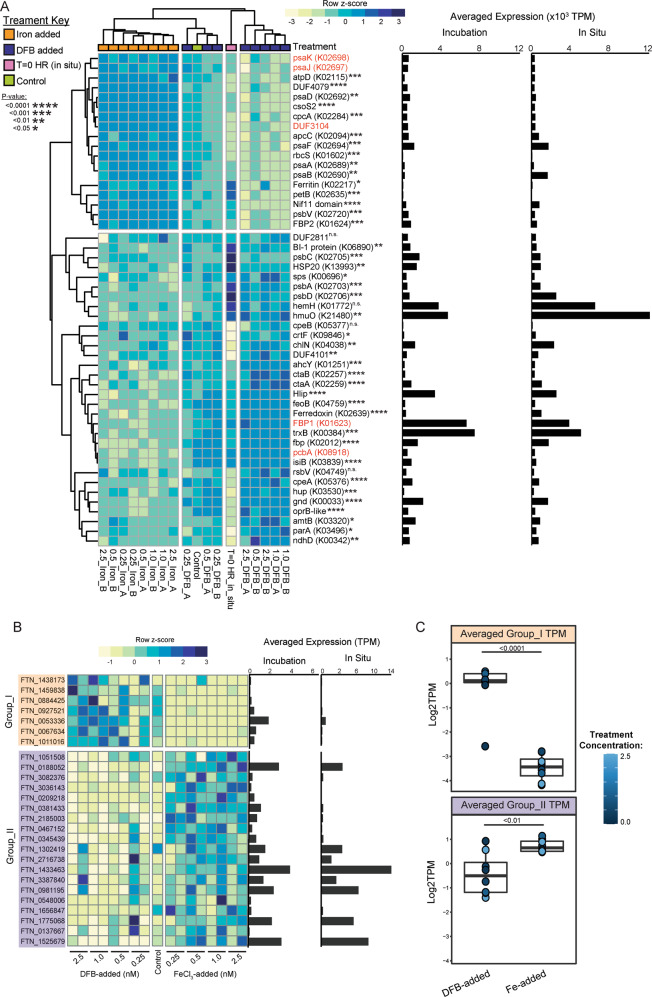
Fig. 5. Transcript abundance patterns of genes assigned to Synechococcus across Fe availability.
A The top 50 most abundant genes with the highest variance across Fe-added and DFB-added incubations. Each column is a different bottle from the GRW1 incubation, where “A” and “B” show the result for each biological replicate per treatment. Each value shows the averaged log2 normalized transcripts (TPM) across all genes identified as the annotation shown next to each row within the heatmap, scaled by row (z-score, [Observed TPM – mean TPM]/standard deviation) and clustered by sample and gene using a Euclidian distance metric. Full gene names are shown in Supplementary Table 9. P values next to each gene were calculated by performing appropriate unpaired t tests between log2(TPM) values from the +DFB-added incubations versus the +Fe-added incubations. Gene names in red were not statistically analyzed due to having a non-normal distribution and heteroskedasticity. The averaged transcript abundance values for each gene are shown alongside within the Fe incubations (left) and across in situ surface samples (right). B Heatmap of individual (un-averaged) Synechococcus ferritin separated between low (orange block, “Group I”) and high-Fe (purple block, “Group II”) expressed genes. Averaged TPM values across the incubation experiments and in situ surface samples for each are shown alongside. Phylogenetic placement of each gene is shown in Supplementary Fig. 4. C Comparison of the averaged values within each ferritin “Group” heatmap between DFB-added and Fe-added incubations. Each dot represents the averaged value within each incubation bottle, color coded by the level of either DFB or Fe added. P-values were calculated using unpaired t-test with Welch’s correction for Group_I values, and the Mann-Whitney non-parametric test for Group_II values.

