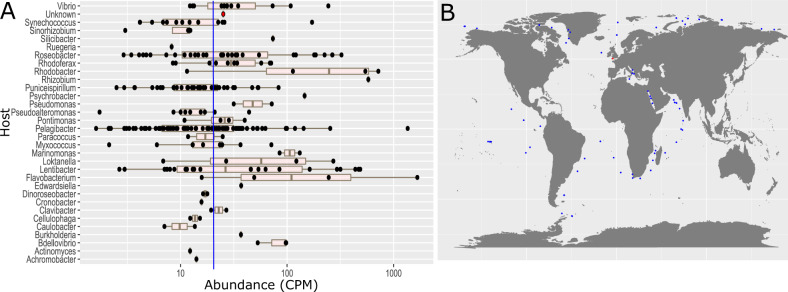
Fig. 2. Abundance and distribution of Mar_Mega_1 -like phages.
A Relative abundance of vOTUs associated with known phages in the Plymouth Sound virome. Abundance is represented by counts per million. Each black dot represents a viral contig that could be associated with a known phage based on mash similarity, or clusters in the same group as a known phage using vContact2. Host information was extracted from known phages. Mar_Mega_1 is represented by a red dot (unknown host). The median relative abundance of all 269 vOTUs with similarity to known phages is denoted by a blue horizontal line. B The distribution of Mar_Mega_1-like phages. Reads from GOS and GOV2.0 were mapped against Mar_Mega_1 and 9 TARA vOTUs carrying a TerL that clustered with Mar_Mega_1. Stations are marked where read coverage was >1x across 70% of the genome. Blue dots denote where Mar_Mega_1-like phages were detected and red where Mar_Mega_1 was detected.

