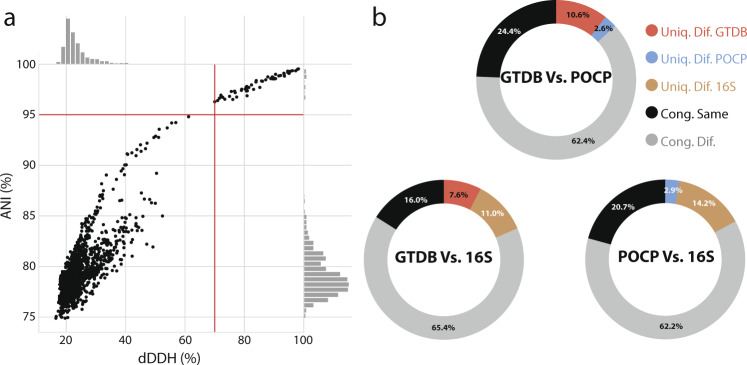
Fig. 3. Comparison of taxonomic delineation methods.
a Pairwise comparisons between the dDDH and ANI values obtained for 70 isolates and their closest relatives, as identified by Protologger (n = 1599). Red lines highlight published boundaries for species delineation: dDDH, <70%; ANI, <95%. b Pairwise comparisons to test the consistency of genus-level delineation parameters (n = 30,247). For each comparison, four groups were formed based on how each method assigned the paired genomes: congruent results, same genus (Cong. Same), congruent results, different genera (Cong. Dif.) and those uniquely identified as belonging to different genera according to the method specified (Uniq. Dif.). See colour code in the figure.

