Figure S3.
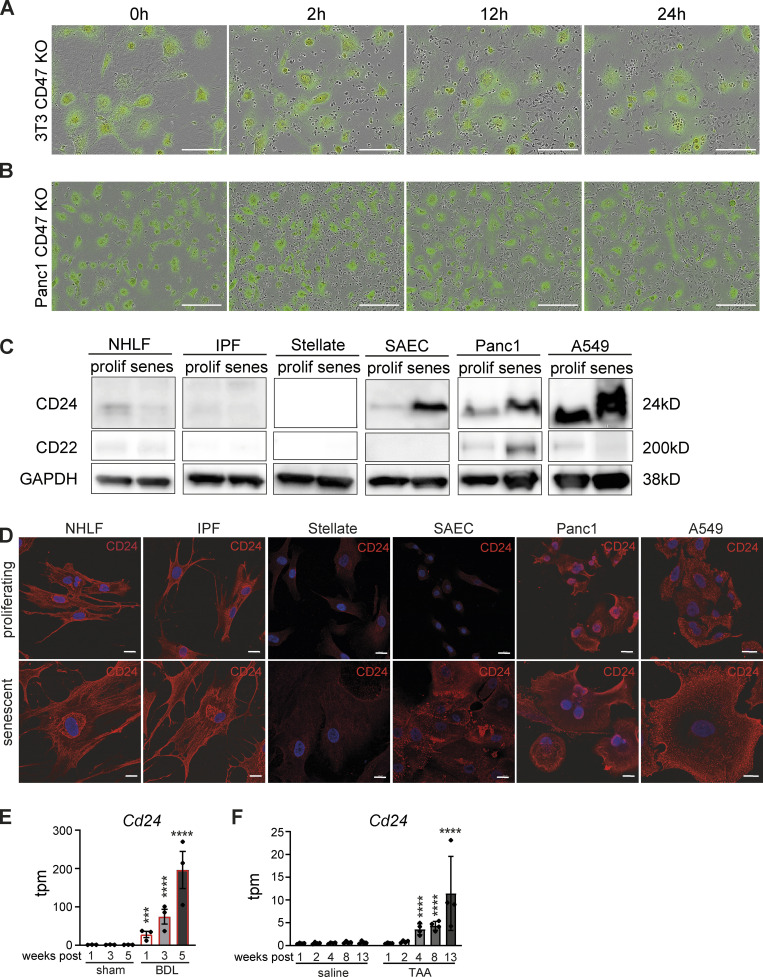
Increased CD24 expression in senescent epithelial cells. (A) Senescent CD47 KO 3T3 cells (labeled with Green Cytolight Rapid Dye) were co-cultured with naïve BMDMs (unstained). Images were taken over 24 h. In each image group, the same field of view was shown across time. Data are representative of three independent experiments; scale bars indicate 200 µm. (B) Senescent CD47 KO Panc1 cells (labeled with Green Cytolight Rapid Dye) were co-cultured with naïve MDMs (unstained). Images were taken over 24 h. In each image group, the same field of view was shown across time. Data are representative of three independent experiments; scale bars indicate 200 µm. (C) Whole-cell lysates from indicated cell types were isolated and analyzed by Western blotting for the indicated proteins. Senescence was induced by chemical treatment. Data are representative of at least two independent experiments. GAPDH images are derived from the same blot as Fig. 7, C and E (SAEC) and Fig. 8 G. CD24 image is derived from the same blot as in Fig. 8 G. (D) Representative immunofluorescence images from indicated cell types (proliferating or senescent) stained for CD24 (red) and Hoechst (blue). Scale bars indicate 20 µm. n = 2. (E and F) Expression levels obtained from RNA-sequencing data for liver fibrosis rat models (Wang et al. 2021). Transcripts per million (tpm) expression values for Cd24 in rat livers derived from bile duct ligation (BDL; E) or thioacetamide (TAA)-induced liver fibrosis (F). Data are represented as mean ± SEM. Significant de-regulation (***P < 0.0005, ****P < 0.0001) was determined by limma/voom based on counts derived from featureCounts. Source data are available for this figure: SourceData FS3.

