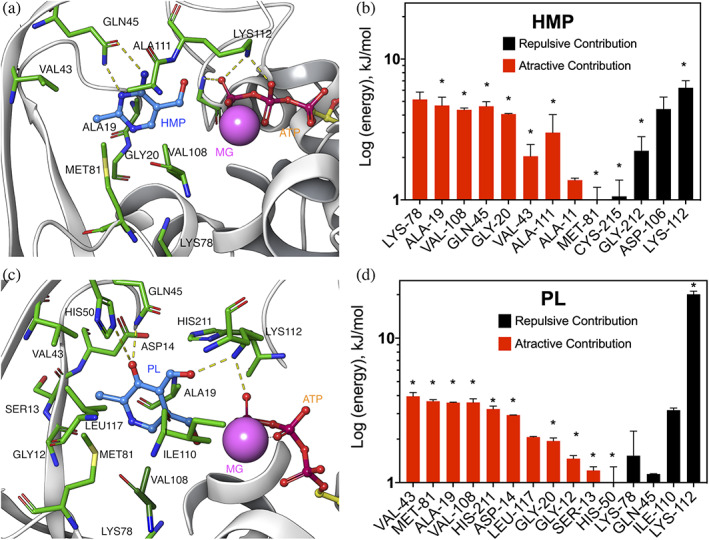
FIGURE 6.

Residues energetic contribution to HMP and PL binding. (a) and (c) HMP and PL binding‐site, respectively. (b) and (d) individual residue contribution to HMP and PL binding, respectively. Residues over 50% of simulation time and over ±1 kJ/mol are shown. Residues at 3 Å, or less, from the ligand are marked with asterisks
