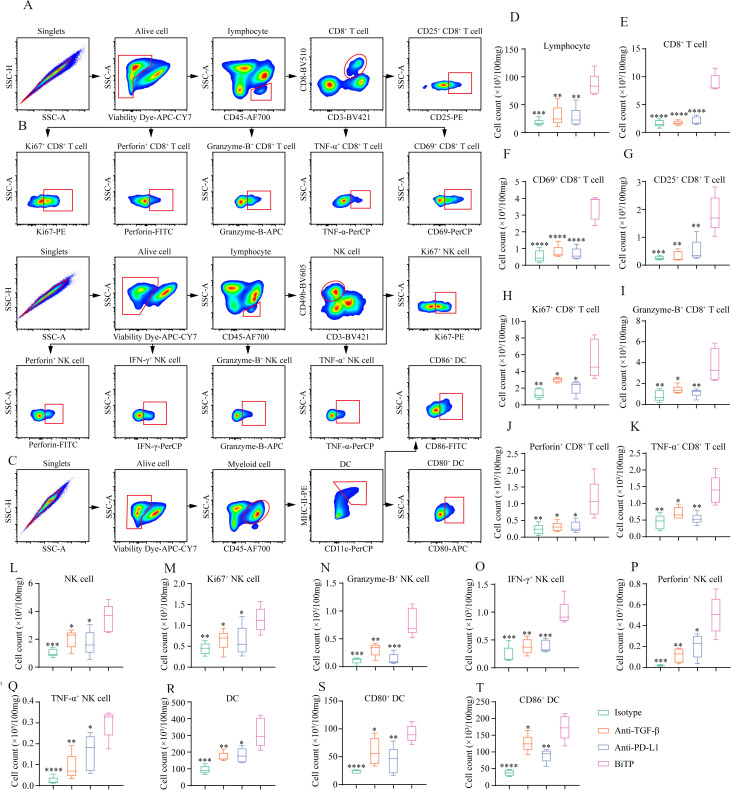
Figure 6.
Flow cytometry to explore the influence of BiTP on the TME in the 4T1-hPD-L1 tumors. (A–C) The gating strategies for CD8+ T cell, NK cell, and DC in flow cytometry assays. (D-T) The quantification of tumor-infiltrating lymphocyte, CD8+ T cell, CD69+ CD8+ T cell, CD25+ CD8+ T cell, Ki67+ CD8+ T cell, Granzyme-B+ CD8+ T cell, Perforin+ CD8+ T cell, TNF-α+ CD8+ T cell, NK cell, Ki67+ NK cell, Granzyme-B+ NK cell, IFN-γ+ NK cell, Perforin+ NK cell, TNF-α+ NK cell, DC, CD80+ DC, and CD86+ DC. *p < 0.05, **p < 0.01, ***p < 0.001, and ****p < 0.0001 mean the significant difference compared with BiTP-treated samples. DC, dendritic cell; TME, tumor microenvironment.

