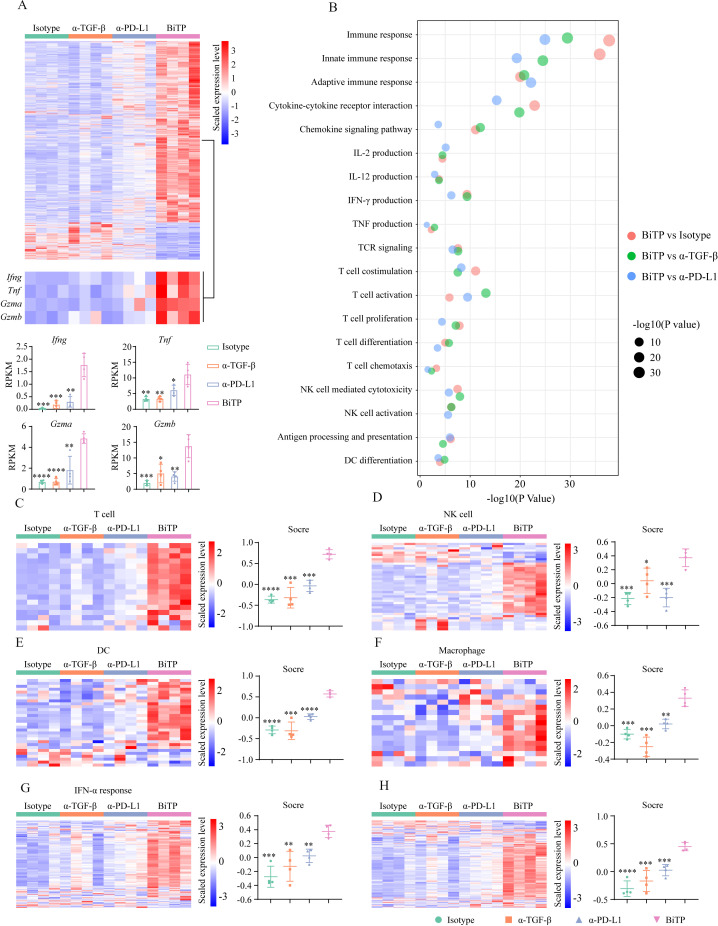
Figure 7.
Bulk RNA-seq to evaluate immune landscape in 4T1-hPD-L1 tumors. Tumor-bearing mice received six doses of antibodies. Then, tumor tissues were collected for bulk RNA-seq assay. (A) The heat map showing differentially expressed gene profiles. (B) The levels of Ifng, Tnf, Gzma, and Gzmb. (C–H) The heat maps representing the expression levels of genes belonging to immune signatures. *p < 0.05, **p < 0.01, ***p < 0.001, and ****p < 0.0001 mean the significant difference compared with BiTP-treated samples. TGF-β, transforming growth factor-beta.

