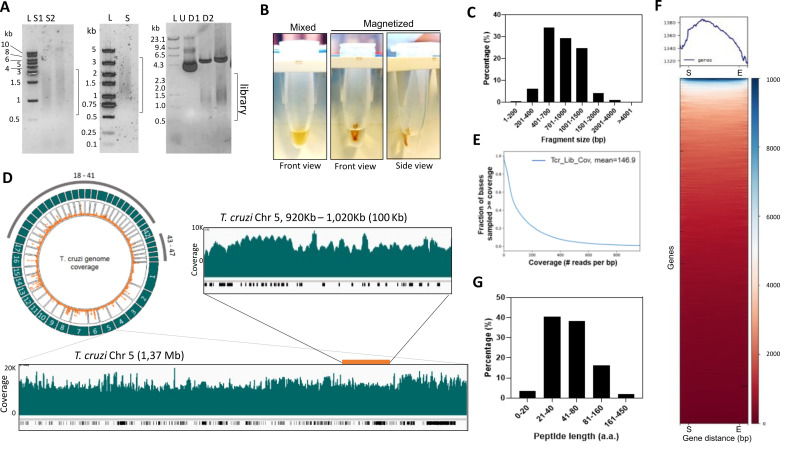
Figure 4. Analysis of T. cruzi genome-wide library for yeast surface display.
(A) Left, genomic DNA sonicated using Covaris M220. DNA was resolved in 1% agarose/TBE gel. S1: incidence power 25, 2 duty factor, 200 cycles per burst, for 20 s; S2: incidence power of 10, duty factor 2, 700 cycles per burst, for 30 s. Middle, 1% agarose/TBE of sonicated genomic DNA size selected using magnetic beads to obtain fragments above 500 bp (S). Right, T. cruzi library cloned in pYD1 vector undigested (U) or digested (D1 and D2) with Hind III and Xho I restriction enzymes. D1: 1.0 µg of DNA; D2: 1.5 µg DNA. (B) Image of microcentrifuge tubes containing 100 µL of sonicated DNA sample and magnetic beads (0.7×) mixed before beads separation (mixed) and after separation in a magnetic rack (magnetization). Front and side views are indicated. (C) Analysis of fragment sequence length. Data were obtained from the Oxford nanopore sequencing summary file. (D) Circlize plot created using the Circlize R package shows the read coverage over the genome. Outer green tracks represent the chromosomes; inner orange dots represent mapped reads. Below is a snapshot of chromosome 5 (Chr 5) visualized using the integrated genome browser. The green plot shows read coverage, and the black bars below indicate genes. A 100 kb segment of the Chr 5 (inset above) is also shown. (E) Library coverage analysis using plotCoverage function (DeepTools) depicting read coverage per fraction of genome after mapping. (F) Heatmap of reads per gene generated by the computeMatrix and plotHeatmap functions. All genes were resized to the same length. A 0.5 kb from the start (S) and after the end of the gene (E) are shown. (G) Distribution of predicted library proteins in frame with proteins from the expression system, i.e., Aga2p and Xpress tag. Data were analyzed using the Libframe tool.

