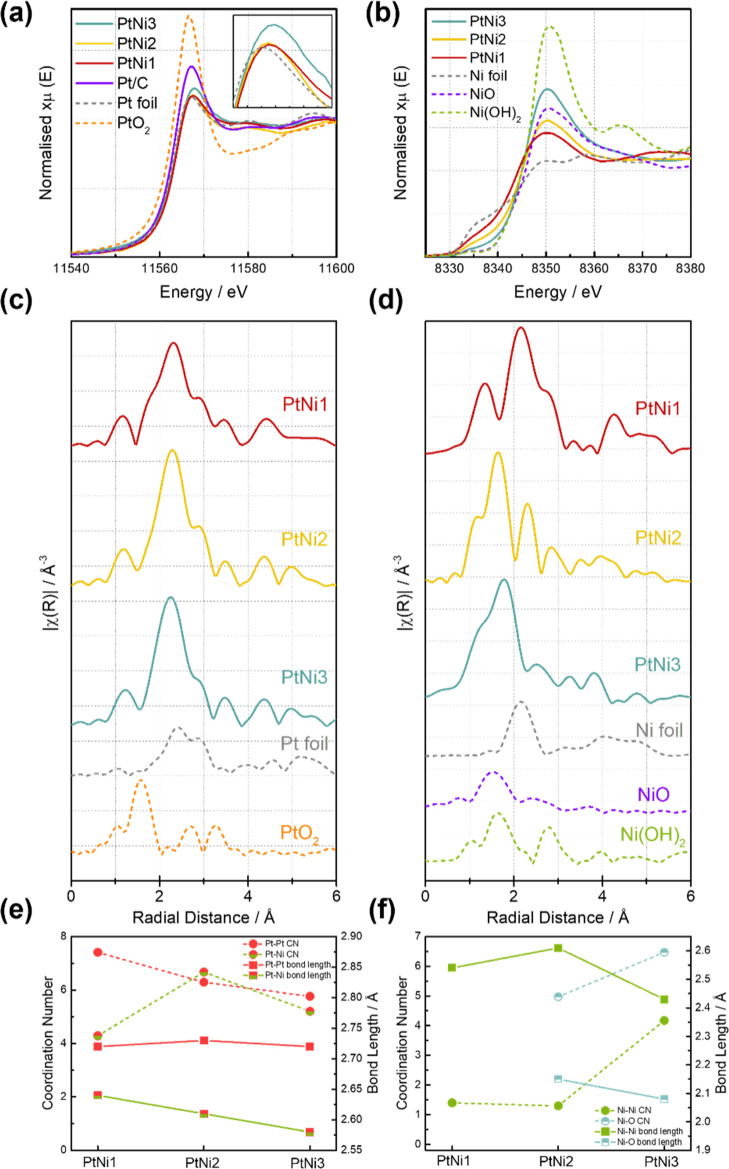
Figure 3.
(a) Pt L3-edge (insert is an enlargement of the white line region) and (b) Ni K-edge XANES spectra of three as-prepared PtNi samples, ex situ, compared with reference materials; (c) Pt and (d) Ni EXAFS spectra showing the main bond formation in PtNi samples. The fitted results and fitting parameters are presented in Figures S6–S8 and Table S2. Local coordination number and bond length of (e) Pt–Pt and Pt–Ni and (f) Ni–Ni and Ni–O according to the fitted results in Table S2.

