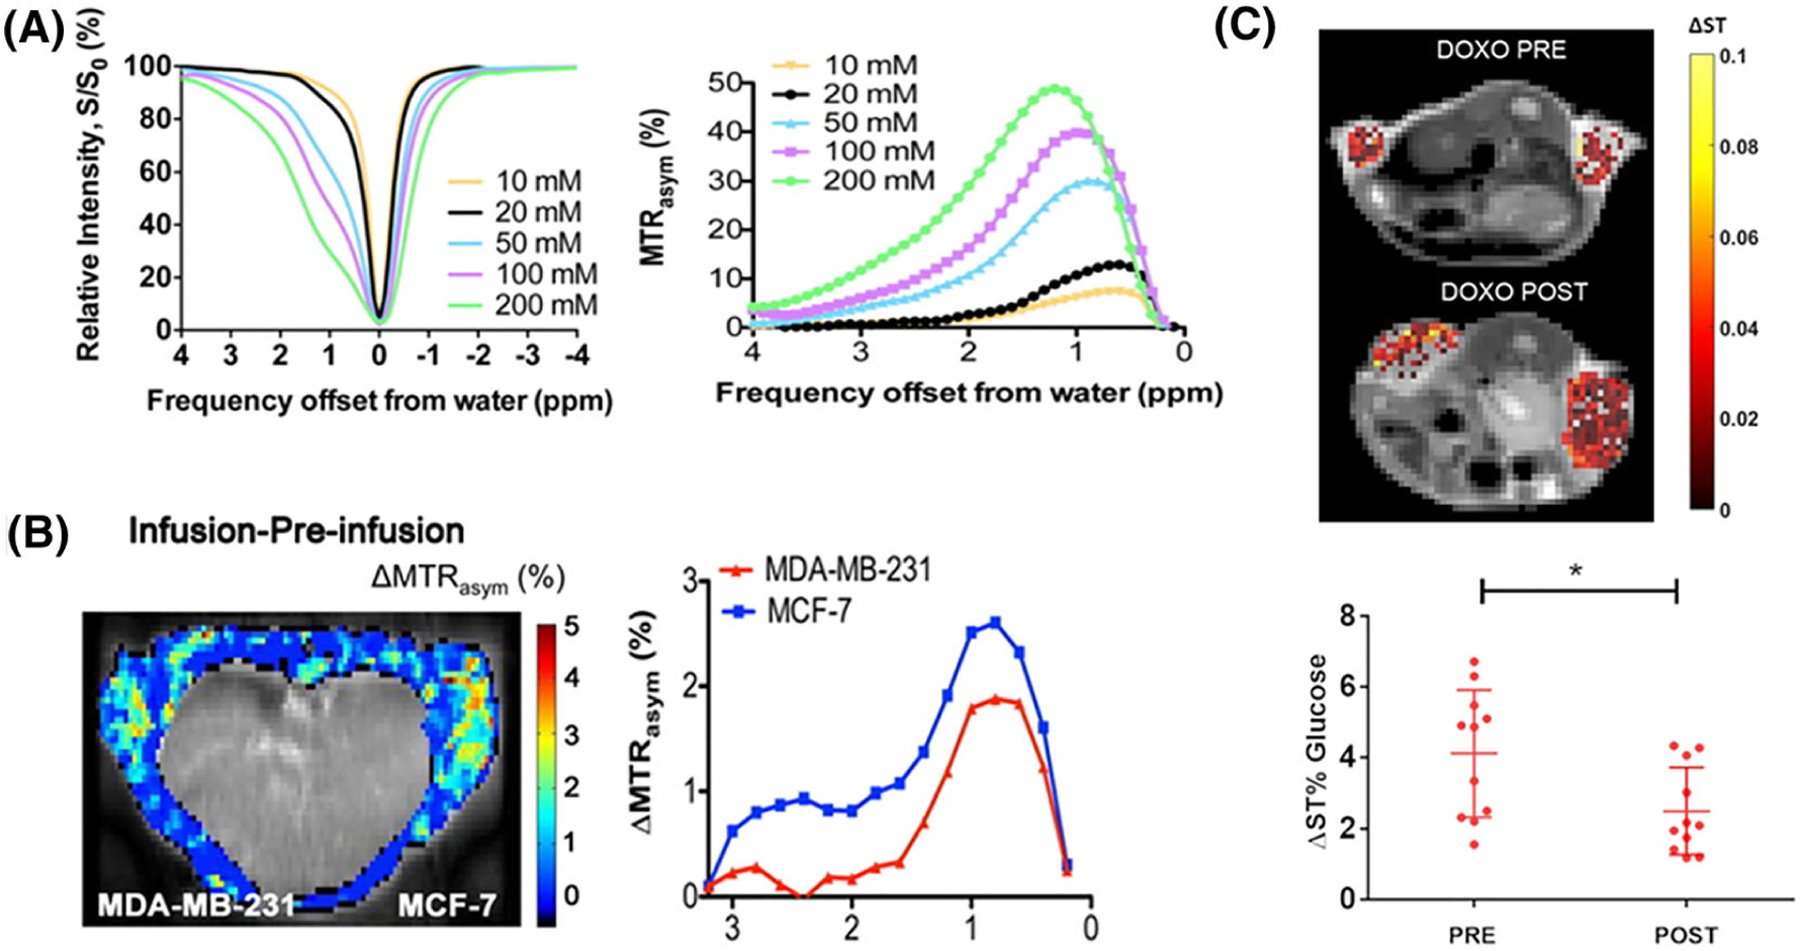
FIGURE 1.

A, Z-spectra (left) and MTRasym (right) as a function of concentration at pH 7.3 for B1 = 1.6 μT. B, Left: GlucoCEST difference map, ΔMTRasym = MTRasym(infusion) − MTRasym(pre-infusion). The intensity of the internal body was thresholded out because it contains moving areas (lungs and heart) that have large magnetic susceptibility differences from surrounding tissues, which complicates difference imaging. Right: the ΔMTRasym profiles of MDA-MB-231 and MCF-7. [Reprinted with permission from Reference 23] C, Top: representative glucoCEST ΔST% maps of 4T1 tumor-bearing mice, before and after treatment. Data are reported as the difference (ΔST%) between the ST effect before and after the intravenous glucose injection. Parametric maps are superimposed on T2w anatomical images, and glucoCEST contrast is shown only in the tumor region. Bottom: graph showing individual GlucoCEST contrast (and mean ± SD) obtained injecting glucose at a 3 g/kg dose via intravenous bolus (n = 6 mice). Data are reported as the variation (ΔST%) between the ST effect post-injection and the ST effect pre-injection. Paired t-test *p = 0.0216. (Reprinted with permission from Reference 26)
