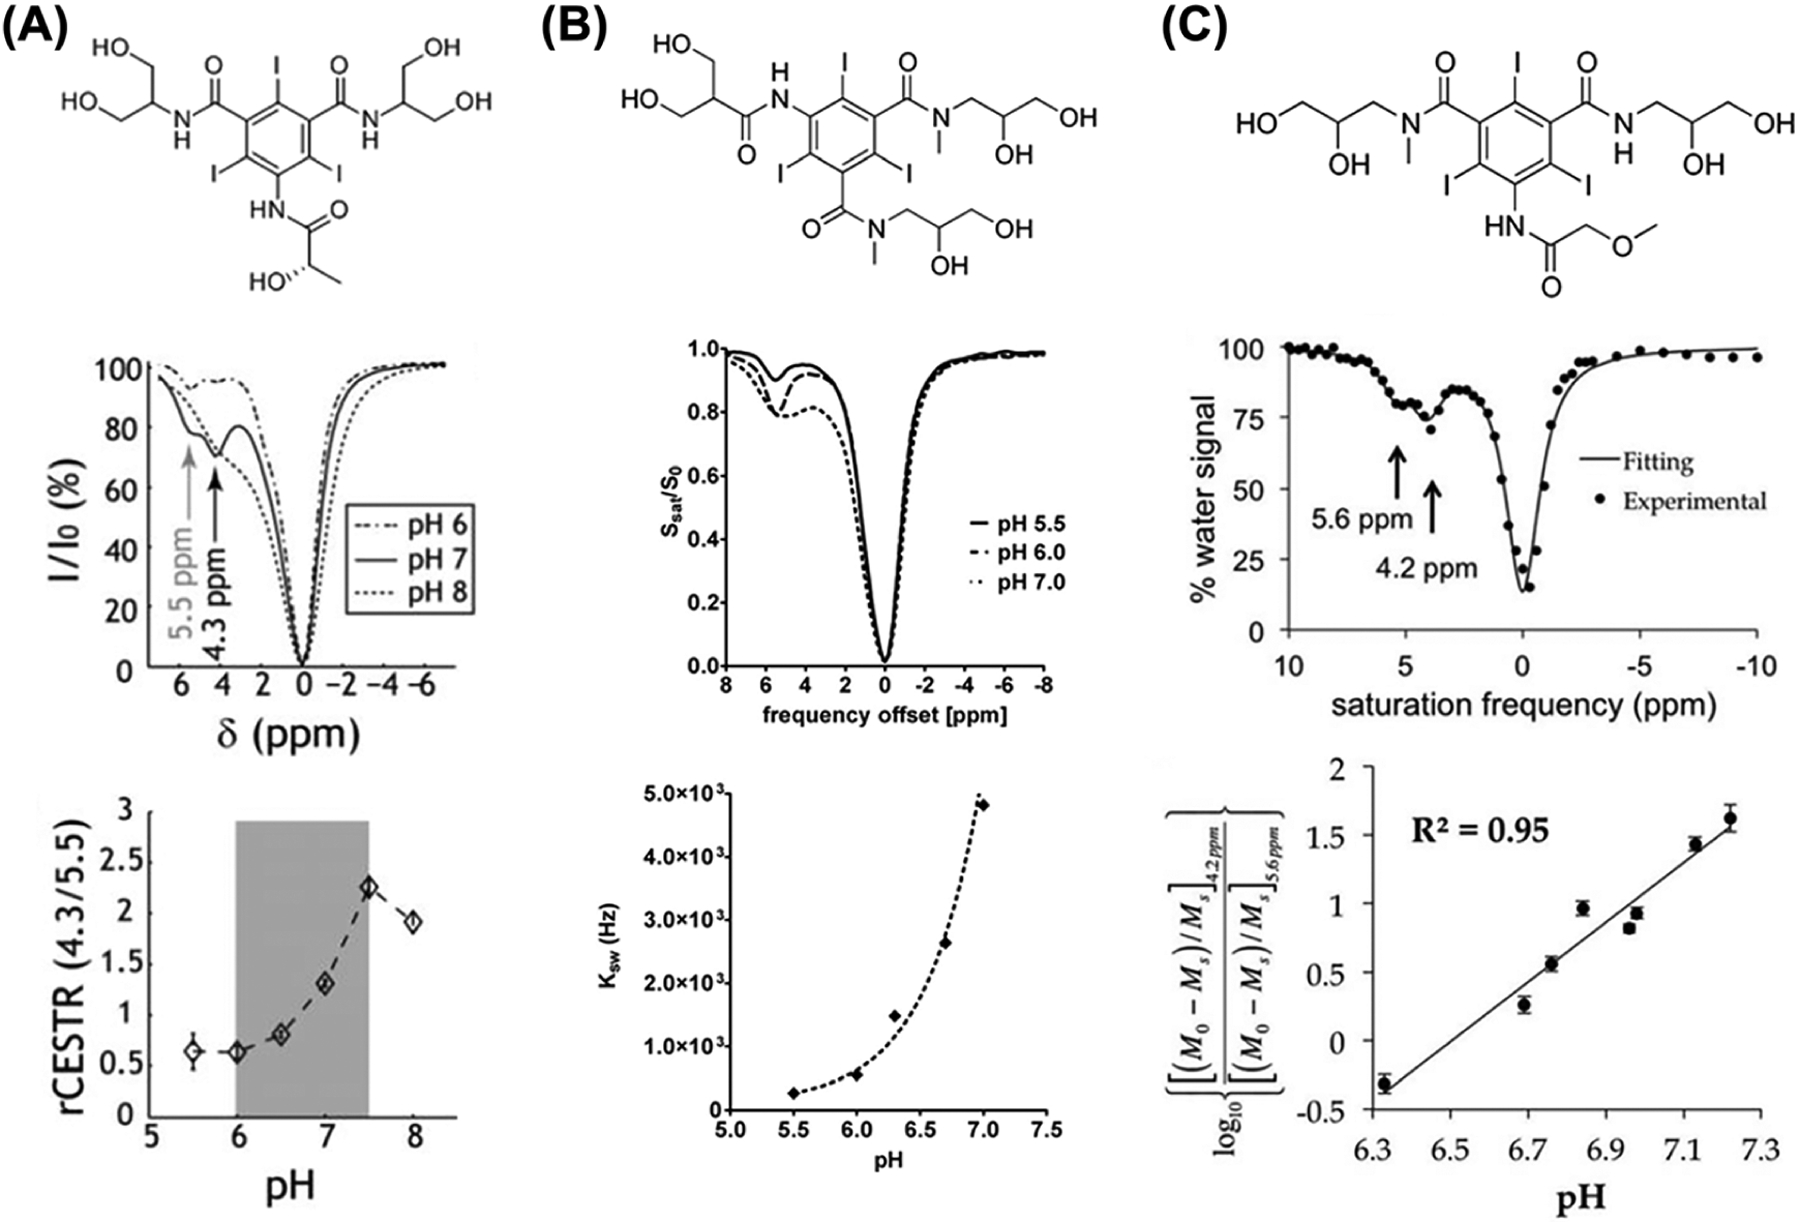
FIGURE 3.

Comparison between iopamidol, iobitridol and iopromide ratiometric pH MRI. A, Top: iopamidol chemical structure. Middle: z-spectra for representative pH values of 6, 7 and 8 (B1 = 2.5 μT, TS = 5 s) at room temperature. Bottom: ratiometric CEST analysis is sensitive to pH ranging from 6 to 7.5. (Adapted from Reference 71.) B, Top: iobitridol chemical structure with a single amide proton group. Middle: CEST spectra of 30 mM iobitridol solution at pH values of 5.5, 6.0 and 7.0. The reduction in MRI signal from bulk water signal upon selective irradiation at 5.6 ppm is pH sensitive (RF saturation power = 3 μT × 5 s, T = 310 K, Bo = 7 T). Bottom: numerically solved pH-dependent chemical exchange rate for labile protons at 5.6 ppm. (Reprinted from Reference 72.) C, Top: the chemical structure of iopromide. Middle: a CEST spectrum of 200 mM iopromide at pH 6.69 and 37.0 °C with saturation applied at 2 μT for 5 s. Bottom: a log10 ratio of the two CEST effects is linearly correlated with pH from pH 6.3 to pH 7.2. (Reprinted from Reference 73)
