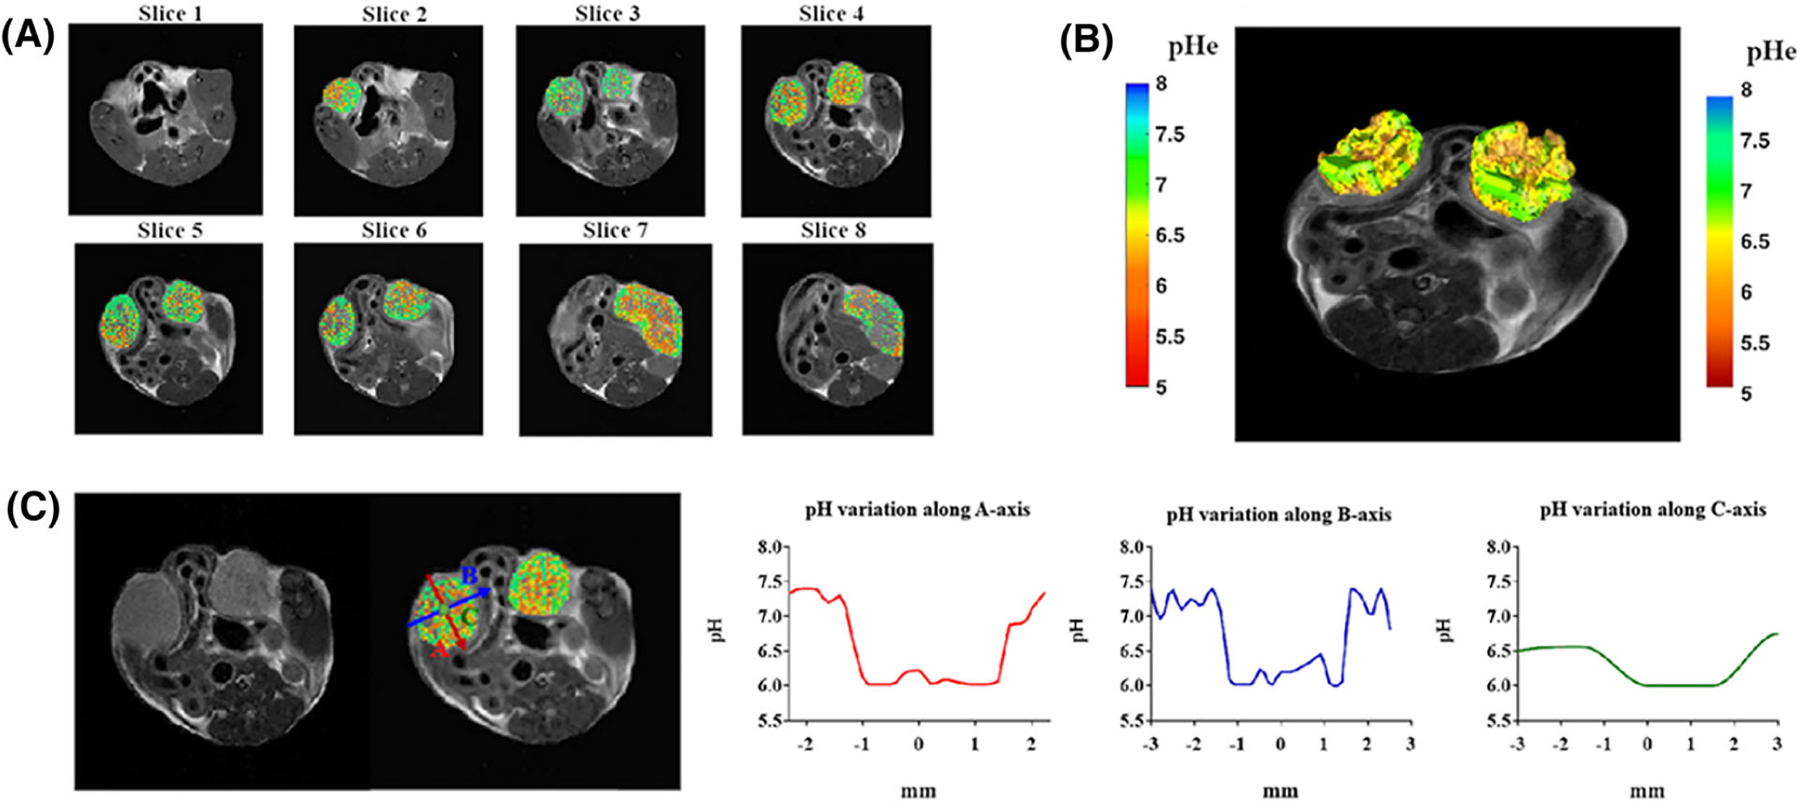
FIGURE 6.

Multislice sequence to measure pH in whole organs. A, Two-dimensional multislice tumor pHe map for a breast tumor murine model. B, Three-dimensional pH map rendering. C, Calculated pH gradients along the three main axes inside the left tumor region showing T2-weighted image, superimposed pH map, and pH gradients along the A-axis (red), B-axis (blue) and C-axis (green). (Reprinted with permission from Reference 73)
