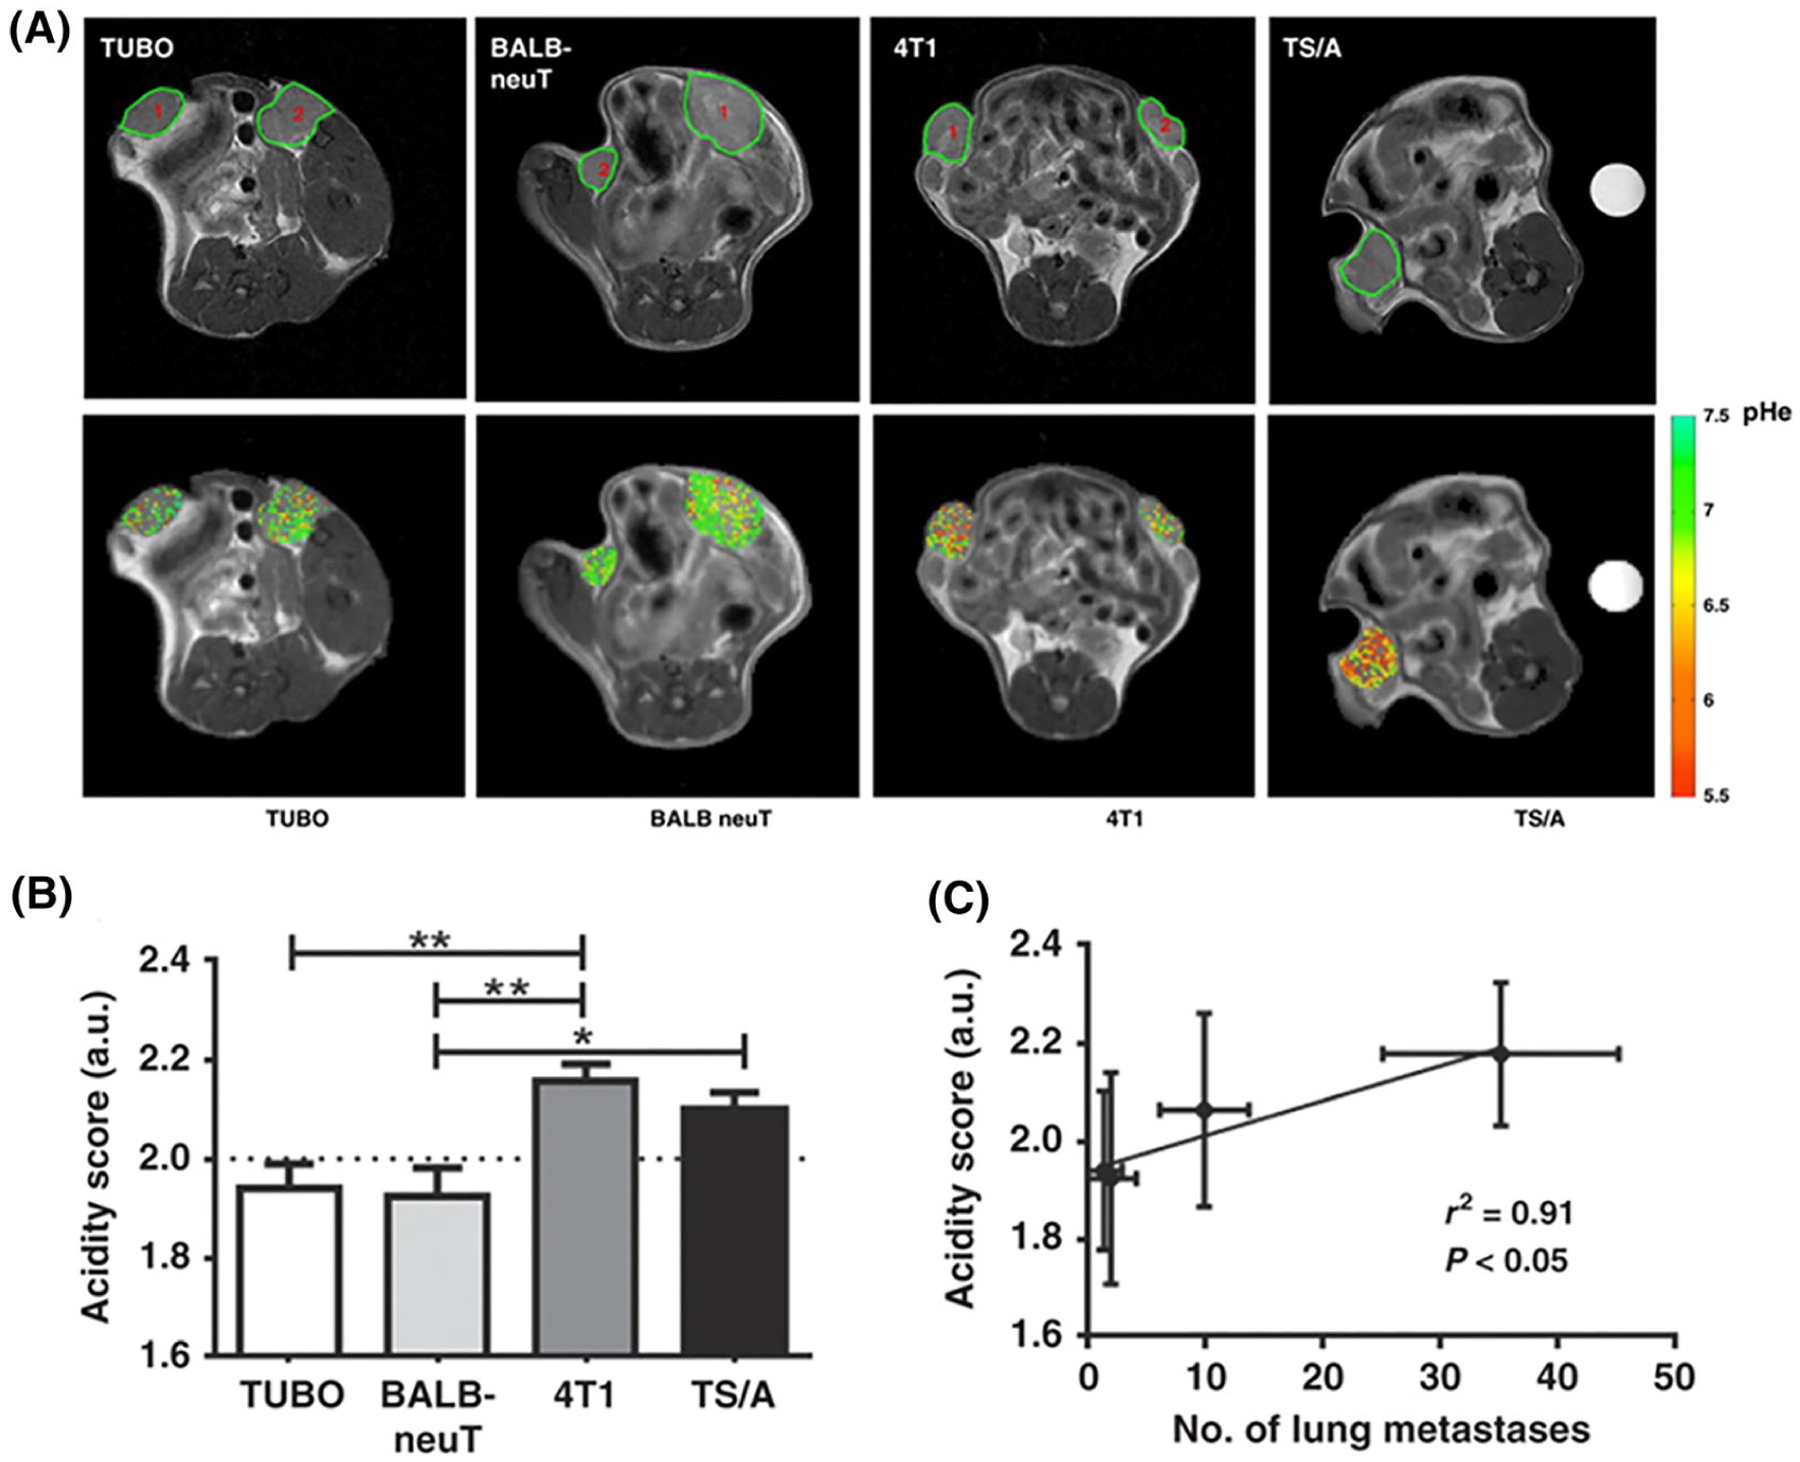
FIGURE 7.

Anatomical images of acidic tumor environment and pHe in vivo correlation with lung metastasis. A, Top: anatomical T2w images of TUBO, BALB-neuT, 4T1 and TS/A representative tumors. Bottom: representative tumor pHe maps for TUBO, BALB-neuT, 4T1 and TS/A tumors. B, Acidity score calculated for TUBO, BALB-neuT, 4T1 and TS/A tumors. *P < 0.05; **P < 0.01. C, Correlation between acidity score and number of lung metastases (r2 = 0.91, P < 0.05). (Reprinted with permission from Reference 136)
