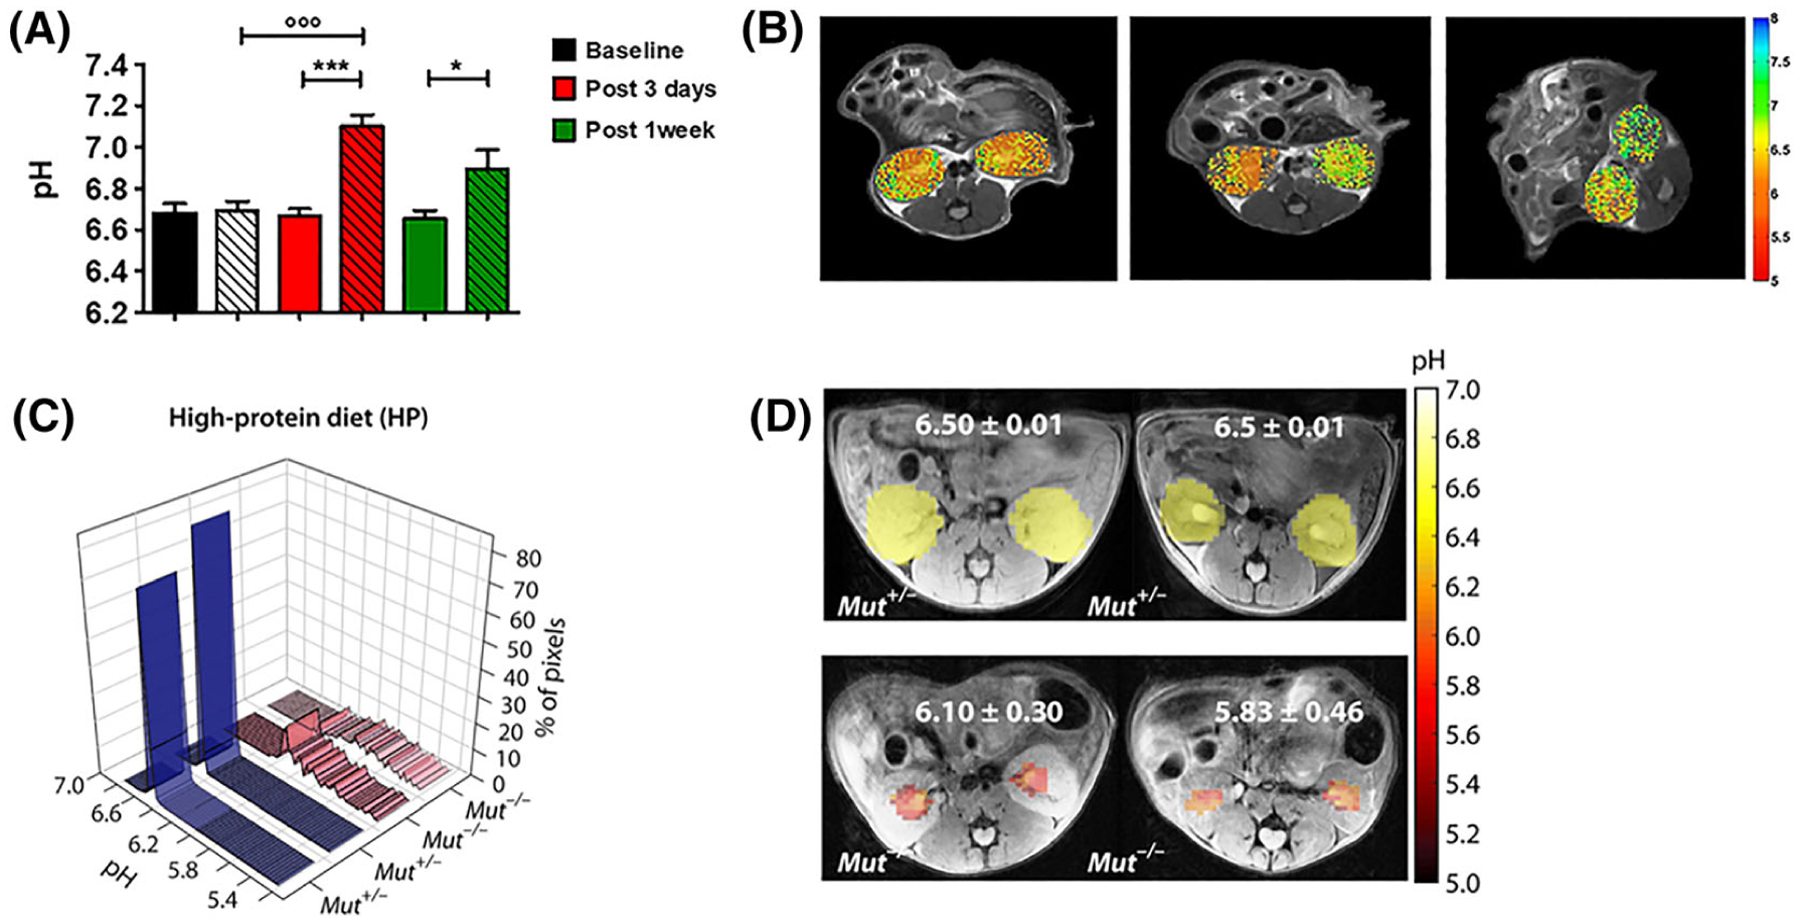
FIGURE 8.

CEST-MRI functional information about renal pH homeostasis. A, Barplots of measured CEST-MRI pH values for the whole kidneys. B, Representative pH maps (for baseline, post-3-day and post-1-week groups, respectively) superimposed onto the T2w images, showing neutral pH values for the clamped kidneys. The arrow shows the clamped kidney. (*P < 0.05; ***P < 0.001; t test contralateral versus clamped. ◦◦◦P < 0.001; Bonferroni’s test baseline versus clamped.) (Reprinted with permission from Reference 140.) C, pH histograms calculated for two representative HP Mut+/− mice and two representative HP Mut−/− mice. For HP Mut+/− mice more than 80% of the detected pixels display a mean pH of 6.50, whereas for HP Mut−/− mice (n = 3) an acidic mean pH of 6.10 to 5.83 was observed. D, Time-averaged pH images of Mut+/− and Mut−/− controls of HP mice. pH was further lowered to 5.83 for the most severely diseased mice. The pH was distributed over a narrow range of 6.50 ± 0.02 for both RD and HP Mut+/− mice, while this range significantly increased to ±0.30 and ±0.46 along with a decrease in mean pH for HP Mut−/− mice. (Reprinted with permission from Reference 142)
