Figure 5.
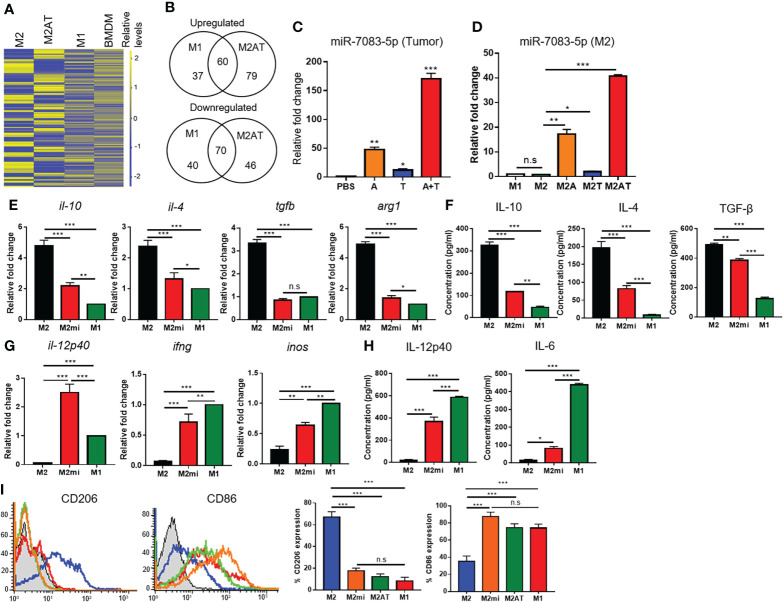
miR-7083-5p is involved in the reprogramming of M2-type macrophage into an M1-like phenotype upon treatment with the combination of 5-aza-dC and TSA. (A) Hierarchical clustering heat map showing the relative levels of miRNAs in M2-type macrophages (M2) after treatment with the combination of 5-aza-dC and TSA (M2AT). M1 macrophages (M1) and bone marrow-derived monocytes (BMDMs) were used as controls. (B) Venn diagrams showing the number of upregulated and downregulated miRNAs in M2AT and M1, as compared to those in M2. (C, D) qRT-PCR analysis of the relative levels of miR-7083-5p in 4T1 tumor tissues, after treatments with 5-aza-dC (referred as A) and TSA (referred as T), alone or in combination (A+T), (C) and in M2 macrophages, after treatments with 5-aza-dC (M2A) and TSA (M2T), alone or in combination (D). (E, G) qRT-PCR analysis of the relative mRNA levels of M2- (E) and M1-type (G) cytokines and markers in M2 macrophages after transfection of miR-7083-5p (M2mi). (F, H) ELISA of the concentrations of M2- (F) and M1-type (H) cytokines secreted into the culture medium of M2 macrophages after transfection of miR-7083-5p. (I) Flow cytometric analysis of CD206 and CD86 expression levels in M2mi and M2AT. *, P<0.05; **, P<0.01; ***, P<0.001; n.s., not significant (n=3 per group), as assessed using one-way ANOVA. Data represent the mean ± SD of three separate experiments performed in triplicates. *, P<0.05; **, P<0.01; ***, P<0.001; n.s., not significant, as assessed using one-way ANOVA followed by Tukey’s multiple comparison post-hoc test.

